Section 7 Plan Performance
- The movement of containers and how the money flows through the Return-It network.
- Revenue and Expenditure detail.
- Purpose of operating reserves, how they are determined and why they’re important.
- Container recycling fees by product type.
7.1 How Money Flows
The arrows show the direction of payments for deposits and container recycling fees (CRF) and the movement of beverage containers.
7.2 Follow the Money
Revenues
Container Recycling Fees
When the revenue from unclaimed deposits and from sales of collected material are insufficient to cover the cost of recovering and recycling a specific container type, a non-refundable recycling fee is added to the container to make up for the shortfall.
Other Fees
Revenues from service provider contracts.
Sale of Processed Containers
A portion of the cost of recovering aluminum and plastic containers, the two largest product categories, is covered by the value of the commodity collected. The prices for aluminum declined, while the prices for plastic increased slightly in 2020 compared to the original forecast. The lower prices for aluminum partially contributed to the decline in our operating reserve levels in 2020. The average price for aluminum was $0.70 per pound ($0.85 in 2019) and plastic was $0.16 per pound ($0.19 in 2019).
Unredeemed Deposits
Encorp is paid a deposit on every container sold. Deposits unclaimed are used to fund the system.
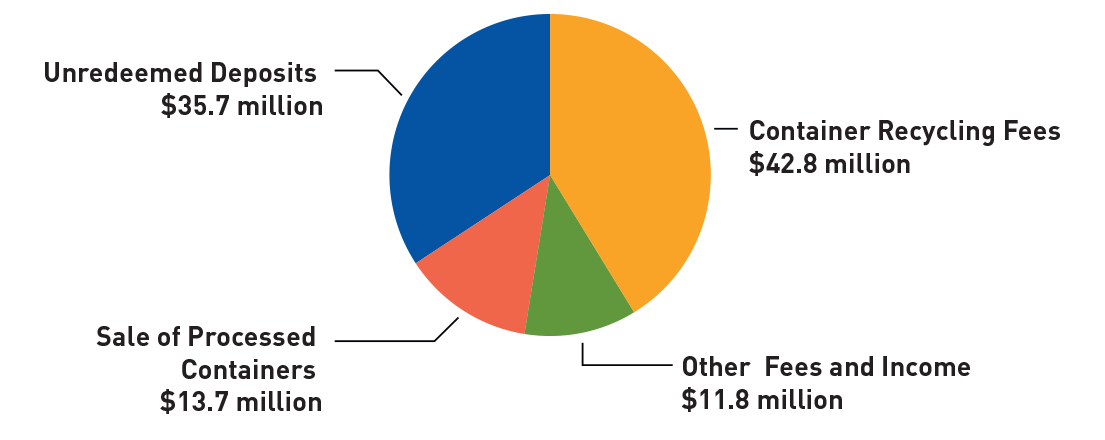
| Container Recycling Fees | $42.8 million | 41.2% |
| Other Fees and Income* | 11.8 million | 11.3% |
| Sale of Processed Containers | 13.7 million | 13.2% |
| Unredeemed Deposits | 35.7 million | 34.2% |
| Total Revenues | 104 million | 100% |
Note: Calculations may show slight variances due to rounding.
Expenditures
Transportation and Processing
Contracted trucking companies collect containers from depots and grocery retailers and take them to processors, where they are compacted for shipment.
Administration
Management of contracts, collection of revenues and payment of expenses.
Consumer Education and Awareness
Programs that encourage consumers to return containers for recycling.
Container Handling Fees
Per-unit fees paid, in addition to deposit reimbursement, to depots for collecting containers.
Deposit Refunds
Paid to depots and grocery retailers to reimburse them for the deposits they have refunded to consumers.
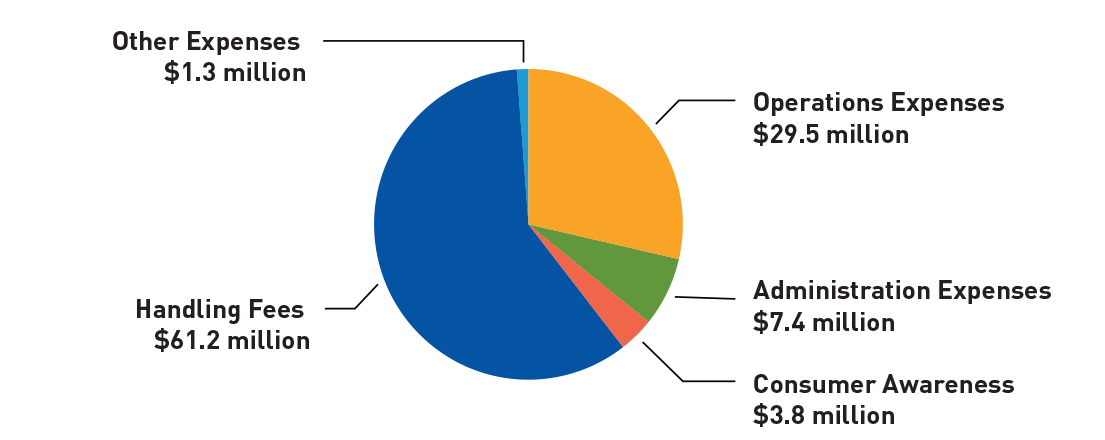
| Operations Expenses | $29.5 million | 28.6% |
| Administration Expenses | 7.4 million | 7.2% |
| Consumer Awareness | 3.8 million | 3.7% |
| Handling Fees | 61.2 million | 59.3% |
| Other Expenses** | 1.3 million | 1.2% |
| Total Expenditures | 103.2 million | 100% |
7.3 Operating Reserves
Purpose of the Operating Reserves
Encorp’s reserves are built upon the corporation’s fundamental principles of no cross-subsidization of container types and equitable treatment of brand owners. The operating reserves are required to provide stability to the system over the long term, to avoid cross-subsidization of container types, and to facilitate and stabilize the frequency of Container Recycling Fee (CRF) changes.
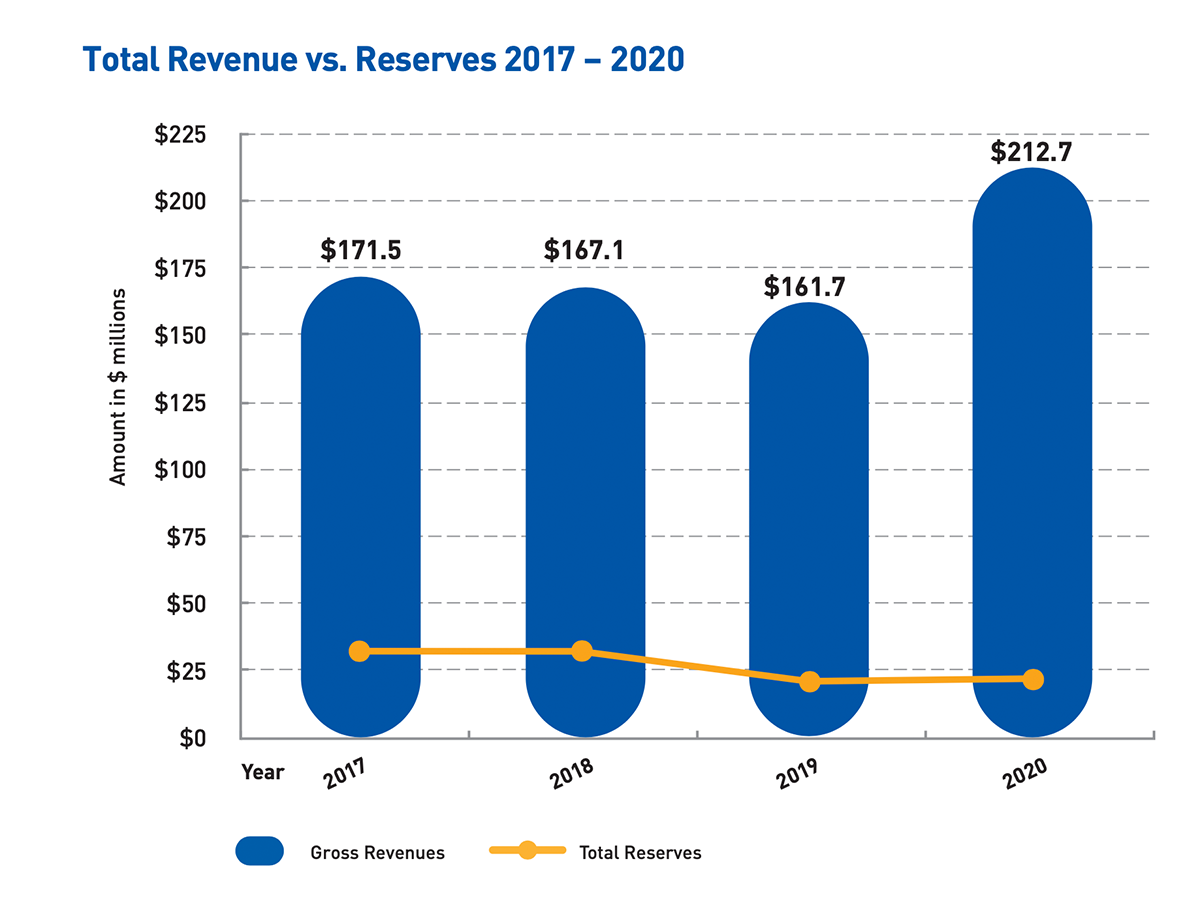
CRFs may be raised, reduced or even eliminated in any given year to keep reserves within their targeted ranges. Reserves can also be reduced by increasing spending on activities designed to improve the recovery rate for a specific container type. The table shows the levels of reserves over recent years.
Management of the Operating Reserves
Encorp’s financial model requires a reasonable level of operating reserves to provide stability to the system and to ensure that stable program operations continue through variable economic conditions. When these reserves rise above the targeted reserve range, measures are taken to reduce them to the appropriate level.
Encorp’s operating reserves are maintained to meet the corporation’s cash flow requirements, recognizing normal business volatility balanced over a period of three to five years.
On average, we pay $4 million in electronic fund transfers (EFTs) per week to customers, depots, transporters and processors. Experience shows that our reserve level needs to be based on the cash flow requirements for six weeks during the peak season. This year, the operating reserve increased by $1 million to a total of $23 million.
7.4 Container Recycling Fees
CRF stands for Container Recycling Fee. This is the fee Encorp charges to cover the net cost of recycling a beverage container type after any unredeemed deposits and commodity revenues for that container type have been used.
CRFs have been in place for beverage containers in British Columbia for more than 18 years. The CRF varies for each beverage container category. As a not-for-profit product stewardship agency, Encorp Pacific only charges the net cost for recovering and recycling beverage containers. The CRF reflects current economic conditions such as commodity prices and beverage volumes.