Back to return-it.ca
6. Deposits, Refunds and Recovery Rates

Section 6 Deposits, Refunds and Recovery Rates

  • Detailed statistics on the weight and number of containers recovered.
  • Summary of overall units recycled, and the per capita statistics.

6.1 Deposit Change

As an industry-owned not-for-profit stewardship agency, Encorp is responsible for managing BC’s beverage container deposit and recycling system, including implementing deposit changes.

Encorp has been operating BC’s beverage container system for 26 years, providing a convenient, efficient and environmentally sustainable network for everyone in BC. Each year, we continue to refine the system and find ways to improve the recovery rate even further. Diverting beverage containers from landfills, oceans and waterways remains one of Encorp’s highest priorities; this goal has been an increasing important part of our mandate over the years.

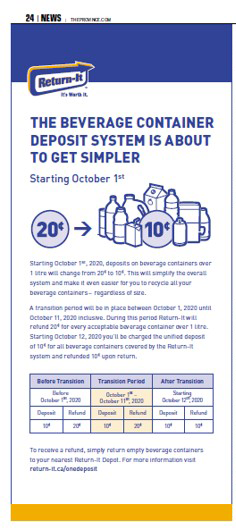
On October 1, 2020 the deposit for all ready-to-drink beverage containers containing soft drinks, juice, water, energy and sports drinks over 1 litre in size changed from 20 cents to 10 cents. Following the 2019 increase of the deposit from 5 cents to 10 cents, this change supported plans to unify the deposit for all beverage containers to 10 cents, enabling Encorp to explore automation technology solutions and implement other changes to reduce the complexity and cost of the system, making it even easier for consumers to recycle all their beverage containers – regardless of size.

Slide the table left and right. (Scroll bar is below table.)
Container Type Deposit Refund before Oct. 1, 2020 Deposit Refund after Oct. 1, 2020
Aluminum 10.0 cents 10.0 cents
Plastic ≤ 1L 10.0 cents 10.0 cents
Plastic > 1L 20.0 cents 10.0 cents
Polystyrene 10.0 cents 10.0 cents
Glass ≤ 1L 10.0 cents 10.0 cents
Glass > 1L 20.0 cents 10.0 cents
Bi-Metal ≤ 1L 10.0 cents 10.0 cents
Bi-Metal > 1L 20.0 cents 10.0 cents
Bag-In-Box 20.0 cents 10.0 cents
Drink Boxes ≤ 500ml 10.0 cents 10.0 cents
Drink Boxes 500ml - 1L 10.0 cents 10.0 cents
Drink Boxes > 1L 20.0 cents 10.0 cents
Gable Top ≤ 1L 10.0 cents 10.0 cents
Gable Top > 1L 20.0 cents 10.0 cents
Drink Pouches 10.0 cents 10.0 cents

Encorp led the change in deposit rates to ensure the increase was managed efficiently and effectively for all British Columbians and the businesses that were impacted by this change. The announcement was made public through a press release in July 2020, followed by a second announcement in September 2020. Consumers were given a transition period to return beverage containers purchased before the deposit change and receive their full deposit refund. A short but effective marketing campaign throughout BC that included TV, radio, online video, newsprint and social media communicated the change across a broad audience.

Click titles below to view content. View all
TV, Radio, and Pre-Roll

TV

One 15-second TV spot was created to let viewers know about the deposit increase for beverage containers in BC. The spot was broadcast on premium channels like Global TV, CTV and CBC across the province.

Total impressions: 3,624,300

Radio

One 10-second radio spot was created to announce the change. The spot ran in the Lower Mainland and the Capital Regional District.

Total impressions: 6,397,000

Pre-Roll

Our 15-second spot ran on streaming platforms, including YouTube, Bell Media, Rogers Network, Corus Entertainment, CBC and Tremor Video.

Total impressions: 661,702

Social Media

Social media posts were shared through all of our networks and boosted with the objective of informing users of the system change and where they could find more information.

Total Impressions: 2,046,821

Deposit Change Social Post
Newspaper

Eight newspaper insertions were published across the major Vancouver and Victoria publications, with 1⁄4-page, full-colour ads. Newspapers included Vancouver Sun, The Province, Victoria Times Colonist and Globe & Mail.

Total Impressions: 1,836,330

Newspaper

6.2 Recycling By the Numbers

We prevented over 1 billion containers from going to landfills in 2020, ensuring that they were recycled into useful new materials and products. That’s a big win for British Columbia’s environment.

1 Billion
Containers Collected
76.2 %
Recovery Rate
$ 109,062,260
Deposits Refunded
Slide the table left and right. (Scroll bar is below table.)
Container Type Containers Sold Containers Recovered % Recovery Rate
2020 2019 2020 2019 2020 2019
Aluminum 526,169,333 504,502,096 435,488,789 407,845,669 82.8% 80.8%
Plastic ≤ 1L 440,695,477 449,480,508 305,708,010 328,589,138 69.4% 73.1%
Plastic > 1L 67,226,444 61,743,716 51,545,906 52,873,013 76.7% 85.6%
Plastic Total 507,921,921 511,224,224 357,253,917 381,462,151 70.3% 74.6%
Glass 214,475,869 215,052,962 186,442,174 196,909,028 86.9% 91.6%
Drink Box 87,773,489 91,402,170 46,542,567 52,939,195 53.0% 57.9%
Gable Top 9,583,034 10,179,965 5,393,629 6,951,325 56.3% 68.3%
Bi-Metal 3,230,886 3,794,610 2,565,186 3,187,644 79.4% 84.0%
Bag-In-Box 4,970,904 3,990,418 2,251,483 2,077,558 45.3% 52.1%
Pouches 8,809,609 8,774,917 2,242,527 2,311,962 25.5% 26.3%
Totals 1,362,935,045 1,348,921,360 1,038,180,271 1,053,684,532 76.2% 78.1%

Note: Calculations may show slight variances due to rounding.

Recovery by Weight

In 2020, Encorp Pacific recovered over 89.98 thousand metric tonnes of containers.

83.2%
2020 Recovery Rate by Weight
87.6%
2019 Recovery Rate by Weight
Slide the table left and right. (Scroll bar is below table.)
Type Estimated Weight of
Containers Sold
(KG)
Estimated Weight of
Containers Recovered
(KG)
Recovery
by Weight
%
Aluminum 7,155.9 5,922.0 82.7%
Plastic 13,982.3 10,004.0 71.5%
Glass 83,123.5 71,830.0 86.4%
Polycoat 2,471.8 1,505.0 60.8%
Pouches 49.2 12.5 25.4%
Bag-In-Box 1,162.6 526.2 45.3%
Bi-Metal 231.3 176.3 75.8%
Totals 108,176.6 89,976.0 83.2%

Note: Calculations may show slight variances due to rounding.


6.3 Regional Per Capita Returns

Provincial Totals:
Units Returned 1,038,180,271
Weight Collected (Tonnes) 89,976.0
Per Capita Units Returned 201.7
Per Capita Weight Collected (Kilograms) 17.5

Regional Breakdown:

Slide the table left and right. (Scroll bar is below table.)
Region Name   Aluminum Plastic Glass Polycoat Other Total Jan-Dec
2020
Per Capita
Jan-Dec
2019
Per Capita
Change to
Per Capita
Container Returns
/ Units (000)
Bulkley / Nechako Units
(000)
4,440 3,804 1,033 485 42 9,803 246.9 243.8 3.1 inc.
  Tonnes 60 99 381 11 5 556 14.0 kg 13.5 kg  
Cariboo Units
(000)
7,439 6,704 2,001 760 106 17,009 259.4 270.3 (10.9) dec.
  Tonnes 101.0 180.0 746.0 20.0 10.0 1,057.0 16.1 kg 16.5 kg  
Central Coast Units
(000)
389 148 61 23 2 623 175.0 172.3 2.7 inc.
  Tonnes 5.0 4.0 23.0 1.0 - 33.0 9.4 kg 11.7 kg  
Fraser - Fort George Units
(000)
13,664 111,913 13,278 11,517 1175 130,546 1293.8 1293.5 0.3 inc.
  Tonnes 186.0 311.0 1,246.0 38.0 15.0 1,796.0 17.3 kg 17.1 kg  
Kitimat - Stikine Units
(000)
4,704 4,196 970 543 65 10,478 257.9 275.7 (17.8) dec.
  Tonnes 64.0 111.0 372.0 13.0 5.0 565.0 13.9 kg 14.5 kg  
Skeena - Queen Charlotte Units
(000)
2,507 2,545 626 238 47 5,963 307.2 344.7 (37.5) dec.
  Tonnes 34.0 67.0 232.0 7.0 3.0 343.0 17.6 kg 19.1 kg  
Northern Rockies Units
(000)
468 712 94 42 5 1,321 264.4 296.3 (31.9) dec.
  Tonnes 6.0 18.0 36.0 1.0 - 61.0 12.4 kg 13.0 kg  
Peace River Units
(000)
7,163 8,514 1,729 859 104 18,369 273.0 265.8 7.2 inc.
  Tonnes 97.0 221.0 645.0 22.0 6.0 991.0 14.7 kg 14.1 kg  
Capital Regional District Units
(000)
37,900 24,960 18,387 3,718 517 85,482 200.9 207.9 (7.0) dec.
  Tonnes 515.0 738.0 7,139.0 115.0 68.0 8,575.0 20.2 kg 21.1 kg  
Cowichan Valley Units
(000)
11,017 7,648 4,105 940 170 23,880 263.1 270.1 (7.0) dec.
  Tonnes 150.0 213.0 1,599.0 28.0 22.0 2,012.0 22.2 kg 22.1 kg  
Alberni / Clayoquot Units
(000)
4,267 3,240 1,480 363 61 9,411 277.7 320.4 (42.7) dec.
  Tonnes 58.0 90.0 560.0 11.0 6.0 725.0 21.4 kg 24.8 kg  
Comox Units
(000)
7,375 5,200 3,275 716 129 16,695 226.6 253.5 (26.9) dec.
  Tonnes 100.0 148.0 1,284.0 23.0 19.0 1,574.0 21.4 kg 23.2 kg  
Mount Waddington Units
(000)
1,883 1,280 373 148 18 3,702 314.4 333.7 (19.3) dec.
  Tonnes 26.0 36.0 143.0 4.0 2.0 211.0 18.0 kg 19.8 kg  
Nanaimo Units
(000)
16,141 12,005 6,882 1,469 270 36,767 213.8 225.7 (11.9) dec.
  Tonnes 220.0 337.0 2,719.0 44.0 40.0 3,360.0 19.5 kg 20.6 kg  
Strathcona Units
(000)
4,567 3,123 1,593 394 66 9,743 197.6 191.8 5.8 inc.
  Tonnes 62.0 88.0 622.0 12.0 10.0 794.0 16.1 kg 15.5 kg  
Greater Vancouver Units
(000)
179,978 156,693 89,018 26,559 3,434 455,682 166.4 173.9 (7.5) dec.
  Tonnes 2,448.0 4,460.0 33,978.0 770.0 281.0 41,936.0 15.3 kg 16.9 kg  
Fraser Valley Units
(000)
32,822 27,199 10,261 3,839 509 74,630 222.6 234.6 (12.0) dec.
  Tonnes 446.0 750.0 3,887.0 107.0 44.0 5,234.0 15.6 kg 15.9 kg  
Powell River Units
(000)
2,241 1,503 898 217 45 4,904 231.0 235.8 (4.8) dec.
  Tonnes 30.0 44.0 347.0 7.0 7.0 435.0 20.5 kg 20.7 kg  
Squamish - Lillooet Units
(000)
4,958 3,501 3,530 434 67 12,490 263.7 286.7 (23.0) dec.
  Tonnes 67.0 100.0 1,360.0 13.0 7.0 1,547.0 32.7 kg 37.8 kg  
Sunshine Coast Units
(000)
2,775 1,572 1,842 264 54 6,507 205.1 217.1 (12.0) dec.
  Tonnes 38.0 48.0 730.0 9.0 9.0 834.0 26.3 kg 27.7 kg  
Central Okanagan Units
(000)
22,131 19,330 10,567 2,274 299 54,601 245.1 239.2 5.9 inc.
  Tonnes 301.0 528.0 4,245.0 67.0 41.0 5,182.0 23.3 kg 22.9 kg  
North Okanagan Units
(000)
11,343 9,707 4,323 1,111 154 26,638 289.0 283.2 5.8 inc.
  Tonnes 154.0 269.0 1,716.0 34.0 21.0 2,194.0 23.8 kg 23.3 kg  
Okanagan - Similkameen Units
(000)
10,076 9,087 5,236 973 166 25,538 283.6 288.2 (4.6) dec.
  Tonnes 137.0 250.0 2,110.0 29.0 25.0 2,551.0 28.3 kg 28.6 kg  
Columbia Shuswap Units
(000)
7,688 5,470 3,026 665 96 16,945 297.8 275.0 22.8 inc.
  Tonnes 105.0 150.0 1,144.0 20.0 13.0 1,432.0 25.2 kg 24.1 kg  
Thompson - Nicola Units
(000)
17,893 15,336 5,726 1,826 237 41,018 278.2 277.6 0.6 inc.
  Tonnes 243.0 413.0 2,172.0 52.0 27.0 2,907.0 19.7 kg 19.6 kg  
Central Kootenay Units
(000)
7,586 3,711 2,534 571 89 14,491 226.7 205.8 20.9 inc.
  Tonnes 103.0 108.0 976.0 17.0 12.0 1,216.0 19.0 kg 18.7 kg  
East Kootenay Units
(000)
8,205 5,871 2,554 663 84 17,377 264.2 247.2 17.0 inc.
  Tonnes 112.0 159.0 1,013.0 19.0 10.0 1,313.0 20.0 kg 19.7 kg  
Kootenay Boundary Units
(000)
3,868 2,282 1,041 325 48 7,564 226.3 212.1 14.2 inc.
  Tonnes 53.0 64.0 405.0 10.0 7.0 539.0 16.1 kg 15.6 kg  
Total Units Units
(000)
435,439 357,254 186,442 51,936 7,059 1,038,180 201.7 207.8 (6.1) dec.
Total Tonnes 5,922 10,004 71,830 1,505 715 89,976 17.5 kg 18.5 kg  

Note: Calculations may show slight variances due to rounding.