05 Environmental Impact
5.1 Container Recycling End Fate Report
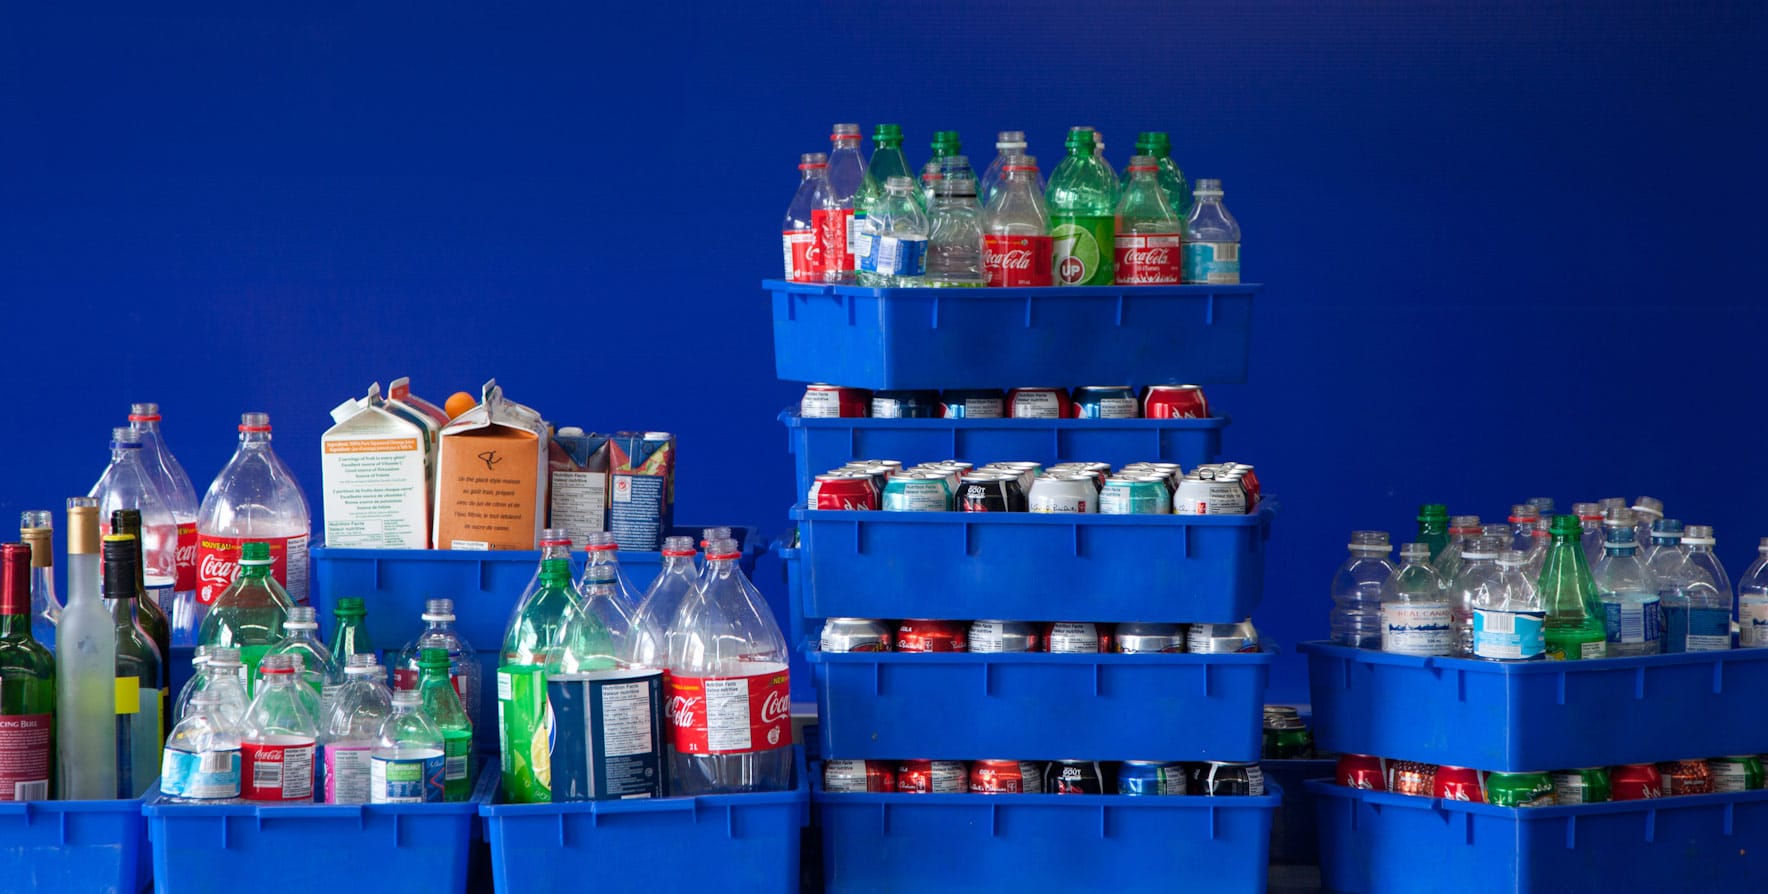
In 2025, Encorp diverted 1.392 billion beverage containers from landfills and the environment. All containers collected through the Return-It program are managed in compliance with the BC Recycling Regulation and are not permitted to be incinerated or landfilled. Each returned container represents recovered value and contributes to advancing a stronger circular economy in British Columbia.
| Material Type |
Fate of Material* (2025) |
Containers Sold
(% of total) |
Recovery %
(by weight of total recovered) |
Energy
Savings |
Weight Diverted
from Landfill (Mt) |
Tonnes CO2
Reduced |
|---|---|---|---|---|---|---|
Aluminum 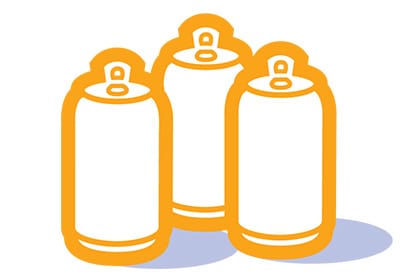 |
Aluminum cans are sold to re-melt facilities in the USA, where they are processed into sheet stock for new cans. Video: Aluminum Can Recycling Process |
40.68% | 81.50% | 93% | 8,016 | 80,828 |
Plastic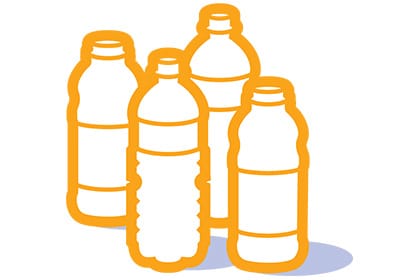 |
Plastic bottles are sold to recycling facilities in British Columbia and Alberta, where they are processed into plastic pellets and flake, mostly food grade for various plastic products, including new bottles and strapping material. Video: Plastic Bottle Recycling Process |
38.01% | 83.20% | 86% | 17,399 | 20,252 |
Glass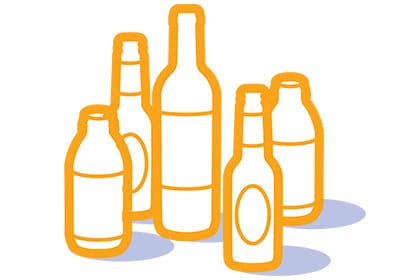 |
Glass bottles are sold to a recycling facility in British Columbia, where they are processed and shipped to manufactures to be turned into glass bottles in the USA, sandblasting materials in BC and fiberglass insulation in Alberta. Video: Glass Bottle Recycling Process |
10.09% | 89.20% | 34% | 54,542 | 17,819 |
Polycoat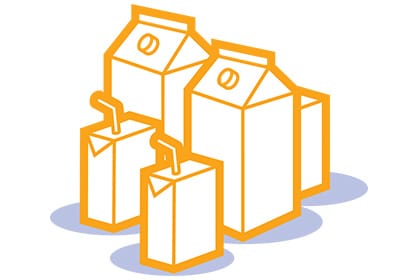 |
Polycoat containers are sent to recyclers in the USA, India, South Korea and Malaysia, where they are processed and turned into building boards, kraft paper, plastic pellets, specialty paper and soft tissue paper. Video: Gable Top Cartons and Drink Box Recycling Process |
10.50% | 58.10% | 53% | 4,001 | 14,628 |
Pouches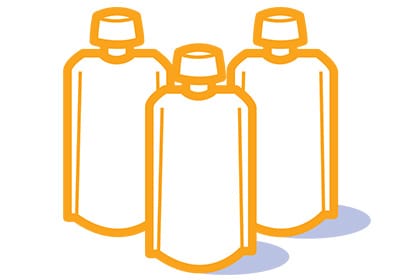 |
Pouches are sent to a recycler in Quebec, where they are processed into plastic pellets. | 0.35% | 20.80% | 53% | 9 | 10 |
Bag-In-A-Box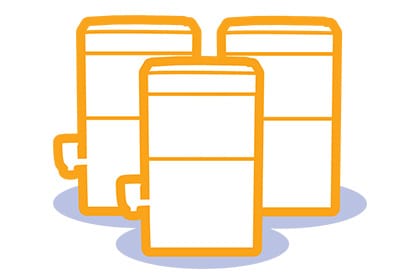 |
Plastic bladders are sent to a recycler in Quebec and converted into rubber floor mats, while the cardboard boxes are recycled into paper products. | 0.21% | 56.40% | 53% | 490 | 1,559 |
Bi-Metal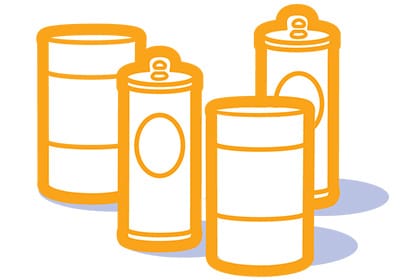 |
Bi-metal containers are sold to local scrap dealers for recycling and metal recovery. | 0.16% | 79.40% | 82% | 124 | 254 |
Ceramic Bottles |
Ceramic bottles are sent to a recycling facility in British Columbia, where they are processed into sand blasting materials and Foam Glass Gravel. | 0.00% | 40.70% | 34% | 9 | 3 |
| 2025 TOTAL | 100% | 84.70% | 84,590 | 135,353 | ||
| For reference 2024 TOTAL |
100% | 83.57% | 87,438 | 125,923 |
* Materials collected directly by Encorp.
Pollution Prevention Hierarchy
Encorp is committed to working with producers to reduce environmental impacts throughout the product life cycle and to increase reusability or recyclability at the end of the life cycle. Material collected under the Encorp program falls under the reuse and recycle level of the pollution prevention hierarchy, with most material being recycled into new products.
5.2 Materials Used to Make New Beverage Containers
Many of Encorp’s registered brand owners have made significant commitments to increasing the use of recycled content in the manufacturing of beverage containers. Encorp supports these efforts by helping ensure a reliable supply of high-quality recycled materials. This is achieved through maintaining strong recovery rates and collecting materials in clean, well-sorted streams so they can meet the quality standards required for reuse in new beverage container production.
Under British Columbia’s Recycling Regulation, nearly any material type may be used for beverage containers. Among the materials collected through the Return-It program, three streams—aluminum, plastic and glass—are suitable for recycling back into new beverage containers. These materials are collected across the province, sold to recyclers and processed to recover usable new raw materials. The recyclers then supply these recovered raw materials to manufacturers that produce new products, including new beverage containers. Other materials collected through the program are typically downcycled into products that can be used for other applications rather than new beverage containers.
The recycling rate is defined as the percentage of material recovered from the recycling process made into new products or raw materials ready to be introduced into new products. Of the beverage containers collected through the Return-It program:
| By units | By Weight | |
| Recycling Rate | 84% | 92% |
| Recycled into New Beverage Containers | 54% | 38% |
Tracking the use of recovered material in the production of new products or new beverage containers is complex and contingent on cooperation among multiple stakeholders throughout the recycling and manufacturing supply chain. Encorp works closely with recyclers to support transparency and reporting through a rigorous downstream accountability program. However, once used beverage containers are sold to recyclers and processed into a marketable commodity, recyclers may sell the recovered material to any buyer based on market demand and economic conditions, regardless of its final application. Encorp relies on physical audits and certified statements from recyclers to compile end fate data.
5.3 Environmental Report
The Government of British Columbia has adopted public policies intended to promote a low-carbon economy. As a stewardship agency operating under a provincial regulation, Encorp compiles applicable data, and analyzes and reports on the impacts of its stewardship activities.
Overview
Encorp Pacific is engaged in the collection, transportation, densifying and shipping of recyclable material. Encorp’s activities take place through a variety of partners and are acknowledged through their Scope 3 emissions reporting. For the 2025 calendar year, Encorp completed its seventh third-party greenhouse gas (GHG) inventory; total GHG emissions were 6,628.15 tonnes of carbon dioxide equivalent (tCO2e) compared with the baseline year (2019), which was 11,794.75 tCO2e. The 2025 reporting year represents a decrease of 44% in GHG emissions from baseline. This decrease in GHG emissions comes with an increase in materials processed.
In 2024, Encorp recycled 87,438 metric tonnes of used beverage containers. This decreased by 3% to 84,590 metric tonnes in 2025. The energy saved through the recycling of these materials has been converted into tonnes of CO2e, which is the common measure of GHG emissions, based on the US Environmental Protection Agency’s Waste Reduction Model (WARM). The avoided emissions published in this report were calculated using WARM Version 15.1 (Updated: 09/2022). Refer to the End Fate table in Section 5.1.
In total, BC’s used beverage container deposit return system contributed to the reduction of about 135.4 thousand tonnes of CO2e from being released into the atmosphere in 2025 as compared with 125.9 thousand tonnes in 2024, and 104.8 thousand tonnes in the 2019 baseline year. The increased CO2e savings reflect the higher volumes of recycled aluminum.
Compactor Trucks
In 2022 Hybrid compactor trucks were added to the operations by way of a pilot project. These trucks travelled to depots and conducted on-site compaction. This compaction reduced the total number of loads required to transport material from the depots to the processing facilities. Furthermore, these compactor trucks were powered by Compressed Natural Gas and not charged by the electrical grid. For the 2025 reporting year the compactor trucks drove 91,927, which reduced diesel-equivalent KM by 178,614 KM resulted in a net GHG reduction of 140.06 tCO2e. For the 2024 reporting year the compactor trucks drove 65,667 KM, which reduced diesel-equivalent KM by 160,000 KM resulted in a net GHG reduction of 352 tCO2e, which is reflected in the reduction in the Transporting Goods – Road category in the GHG Emissions Summary.
GHG Emissions Summary
The following table is a summary of Encorp’s emissions for the 2025 calendar year inventory:
The table above is a summary of Encorp’s emissions for the 2025 calendar year.