Back to return-it.ca
6. Deposits, Refunds and Recovery Rates

6.1 Recycling by the Numbers

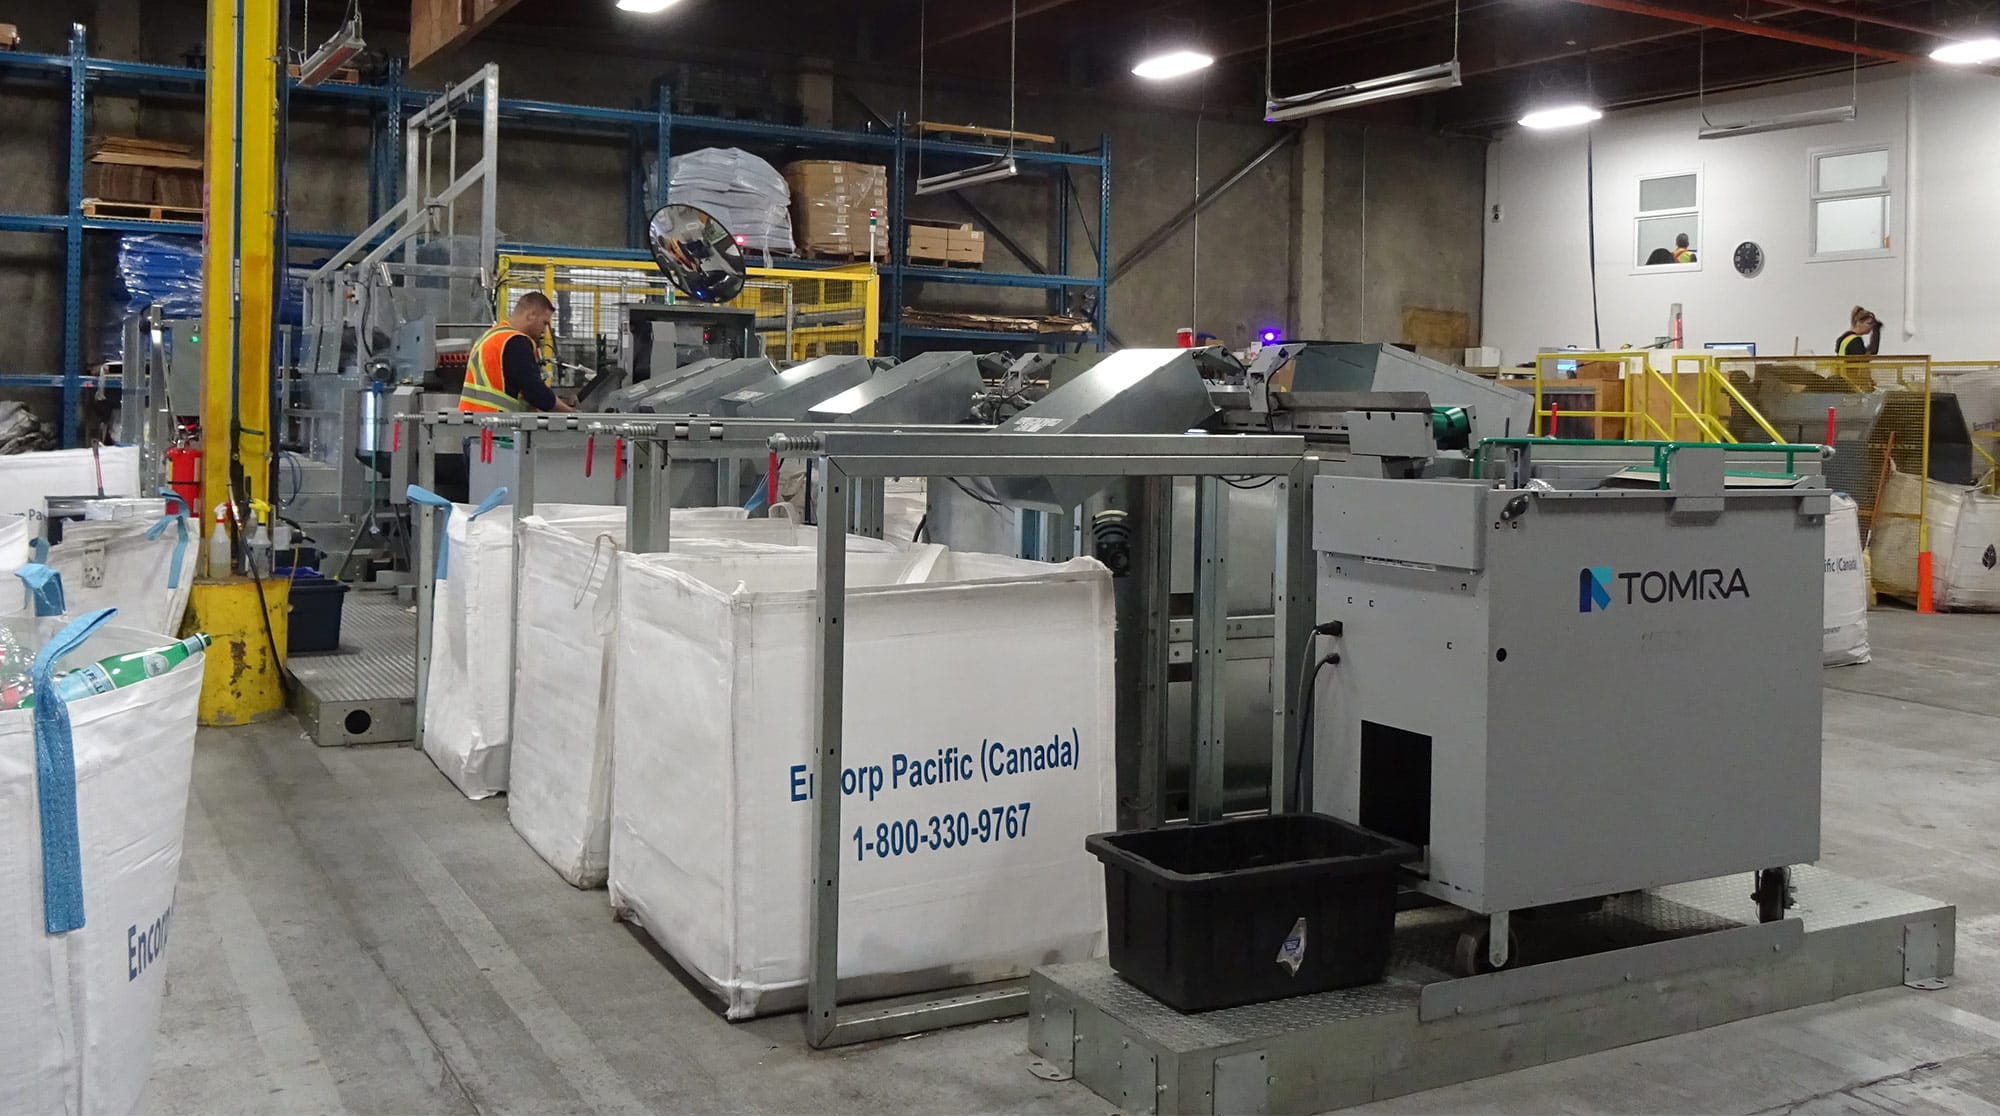
In 2025, Encorp prevented 1.392 billion containers from going to landfills. By doing so, Encorp ensured that these containers were sent to be recycled into useful new materials and products, which positively impacts British Columbia’s environment.

1.392 Billion
Containers Collected
78.5 %
Recovery Rate
$ 139,236,749
Deposits Refunded
Slide the table left and right. (Scroll bar is below table.)
Container Type Containers Sold Containers Recovered % Recovery Rate
2025 2024 2025 2024 2025 2024
Aluminum 721,677,565 671,317,334 588,127,674 552,345,694 81.5% 82.3%
Plastic ≤ 1L 539,329,040 538,000,647 407,962,471 418,448,837 75.6% 77.8%
Plastic > 1L 135,096,667 140,485,888 126,952,304 121,454,603 94.0% 86.5%
Plastic Total 674,425,707 678,486,535 534,914,775 539,903,440 79.3% 79.6%
Glass 178,924,240 190,004,599 159,640,710 166,422,568 89.2% 87.6%
Ceramics 14,245 5,796 40.7%
Drink Boxes 117,813,681 120,518,770 59,864,069 58,265,864 50.8% 48.3%
Gable Top Cartons 68,479,312 71,817,821 43,868,051 43,520,605 64.1% 60.6%
Bi-Metal 2,835,861 3,576,470 2,499,034 2,839,389 88.1% 79.4%
Bag-In-A-Box 3,795,488 3,990,919 2,141,200 2,230,834 56.4% 55.9%
Pouches 6,230,065 7,476,877 1,300,384 1,768,531 20.9% 23.7%
Totals 1,774,196,165 1,747,189,325 1,392,361,693 1,367,296,925 78.5% 78.3%

Note: Calculations may show slight variances due to rounding.

Recovery by Weight

84.7%
2025 Recovery Rate by Weight
83.6%
2024 Recovery Rate by Weight
Slide the table left and right. (Scroll bar is below table.)
Type Estimated Weight of
Containers Sold
(Mt)
Estimated Weight of
Containers Recovered
(Mt)
Recovery
by Weight
%
Aluminum 9,837 8,016 81.5%
Plastic 20,920 17,399 83.2%
Glass 61,142 54,542 89.2%
Polycoat 6,885 4,001 58.1%
Pouches 42 9 20.8%
Bag-In-A-Box 869 490 56.4%
Bi-Metal 141 124 88.1%
Ceramics 23 9 40.8%
Totals 99,857 84,590 84.7%

Note: Calculations may show slight variances due to rounding.

Encorp

6.2 Regional Per Capita Returns

Provincial Totals:
Units Returned 1,392,361,693
Weight Collected (Metric Tonnes) 84,590
Per Capita Units Returned 244.4
Per Capita Weight Collected (Kilograms) 14.8

Regional Breakdown:

Slide the table left and right. (Scroll bar is below table.)
Region Name   Aluminum Plastic Glass Polycoat Other Total Jan-Dec
2025
Per Capita
Jan-Dec
2024
Per Capita
Change to
Per Capita
Container Returns
Bulkley/Nechako Units(000) 5,664 5,389 877 778 47 12,754 323.1 328.9 (5.8) dec.
  Tonnes 77 170 299 28 5 579 14.67 15.6 kg  
Cariboo Units(000) 9,694 9,948 1,765 1,181 90 22,678 338.5 334.2 4.2 inc.
  Tonnes 132 313 603 45 11 1,105 16.49 18.2 kg  
Central Coast Units(000) 510 389 76 53 3 1,030 260.1 275.3 (15.2) dec.
  Tonnes 7 12 26 2 0 48 12.01 12.4 kg  
Fraser – Fort George Units(000) 16,061 15,025 2,619 2,179 126 36,011 334.6 345.4 (10.9) dec.
  Tonnes 219 474 895 78 13 1,678 15.59 17.2 kg  
Kitimat – Stikine Units(000) 6,382 5,853 863 772 46 13,916 328.0 334.0 (6.0) dec.
  Tonnes 87 185 295 28 5 599 14.12 15.2 kg  
Skeena – Queen Charlotte Units(000) 3,160 2,882 488 349 27 6,905 360.9 333.1 27.8 inc.
  Tonnes 43 91 167 12 2 315 16.47 16.4 kg  
Northern Rockies Units(000) 649 857 97 68 4 1,675 356.5 432.2 (75.7) dec.
  Tonnes 9 27 33 3 0 72 15.34 18.3 kg  
Peace River Units(000) 8,757 10,241 1,394 1,278 70 21,740 320.4 318.2 2.2 inc.
  Tonnes 119 323 476 48 5 971 14.31 15.0 kg  
Capital Regional District Units(000) 54,255 38,227 15,099 9,211 444 117,236 252.6 250.1 2.5 inc.
  Tonnes 739 1,219 5,159 374 55 7,547 16.26 16.9 kg  
Cowichan Valley Units(000) 15,453 11,164 3,433 1,874 147 32,071 334.7 319.2 15.5 inc.
  Tonnes 211 350 1,173 72 20 1,826 19.06 19.6 kg  
Alberni/Clayoquot Units(000) 6,342 4,854 1,445 727 44 13,412 369.4 363.9 5.5 inc.
  Tonnes 86 151 494 28 6 766 21.09 22.2 kg  
Comox Units(000) 10,326 7,007 2,823 1,593 98 21,847 272.7 264.4 8.3 inc.
  Tonnes 141 223 965 63 15 1,407 17.56 18.3 kg  
Mount Waddington Units(000) 2,251 1,836 384 253 15 4,738 417.5 411.0 6.5 inc.
  Tonnes 31 58 131 10 2 231 20.39 21.4 kg  
Nanaimo Units(000) 22,182 16,353 6,047 3,035 210 47,827 254.9 250.3 4.5 inc.
  Tonnes 302 521 2,066 118 32 3,040 16.20 16.8 kg  
Strathcona Units(000) 6,794 4,971 1,527 820 61 14,172 273.3 269.4 3.9 inc.
  Tonnes 93 158 522 32 9 813 15.69 16.3 kg  
Greater Vancouver Units(000) 249,803 254,152 75,324 55,503 3,008 637,790 206.6 200.9 5.7 inc.
  Tonnes 3,405 8,513 25,737 2,142 245 40,042 12.97 13.2 kg  
Fraser Valley Units(000) 40,547 40,297 8,457 6,456 380 96,138 260.4 261.0 (0.6) dec.
  Tonnes 553 1,277 2,890 240 41 5,000 13.54 14.4 kg  
Powell River Units(000) 3,168 2,094 746 429 35 6,472 280.9 275.0 5.9 inc.
  Tonnes 43 67 255 17 6 388 16.83 17.7 kg  
Squamish - Lillooet Units(000) 7,217 5,143 3,300 913 54 16,627 293.8 285.0 8.8 inc.
  Tonnes 98 164 1,128 37 5 1,431 25.30 23.5 kg  
Sunshine Coast Units(000) 4,106 2,379 1,777 564 52 8,808 249.0 247.3 1.6 inc.
  Tonnes 56 76 583 24 8 747 21.12 22.3 kg  
Central Okanagan Units(000) 31,839 27,001 9,894 4,673 258 73,664 289.3 290.9 (1.6) dec.
  Tonnes 434 856 3,381 179 37 4,886 19.19 20.3 kg  
North Okanagan Units(000) 14,313 12,266 3,624 2,012 116 32,330 322.8 315.5 7.4 inc.
  Tonnes 195 388 1,238 77 17 1,916 19.13 19.7 kg  
Okanagan - Similkameen Units(000) 13,498 11,961 4,527 1,845 144 31,975 339.0 335.1 3.8 inc.
  Tonnes 184 378 1,547 72 22 2,203 23.36 24.6 kg  
Columbia Shuswap Units(000) 8,723 6,936 2,517 1,137 76 19,389 308.8 301.8 7.0 inc.
  Tonnes 119 220 860 44 11 1,254 19.97 20.7 kg  
Thompson - Nicola Units(000) 23,634 21,013 5,105 3,110 195 53,057 335.7 332.7 3.0 inc.
  Tonnes 322 663 1,744 114 24 2,867 18.14 19.1 kg  
Central Kootenay Units(000) 8,601 5,479 2,169 1,162 80 17,491 255.0 251.0 4.0 inc.
  Tonnes 117 174 741 45 10 1,088 15.86 16.6 kg  
East Kootenay Units(000) 9,742 7,931 2,386 1,156 68 21,284 292.0 292.2 (0.2) dec.
  Tonnes 133 246 815 46 9 1,249 17.13 17.5 kg  
Kootenay Boundary Units(000) 4,458 3,267 960 602 46 9,332 262.8 262.4 0.4 inc.
  Tonnes 61 104 328 23 6 522 14.70 15.3 kg  
Total Units Units(000) 588,128 534,915 159,653 103,732 5,941 1,392,368 244.4 239.9 4.4 inc.
Total Weight Tonnes 8,016 17,399 54,552 4,001 623 84,590 14.8 kg 15.3  

Note: Calculations may show slight variances due to rounding.

6.3 Refillable Milk Annual Reporting 2025

Select dairy producers using refillable glass bottles for milk have appointed Encorp Pacific (Canada) to fulfill some annual reporting requirements in compliance with the British Columbia Recycling Regulation. Encorp has not been appointed as their agent to fulfill all regulatory requirements of the BC Recycling Regulation.

Dairy producers that sell milk in refillable glass bottles establish their own deposit values to encourage the return and reuse of bottles. Deposit amounts typically range from $1.50 to $2.75, depending on the producer and bottle size.

These refillable glass bottles are not part of the Return-It deposit system. Instead, they operate through independent collection and refill programs managed by the dairies.

2025 Performance Summary

Slide the table left and right. (Scroll bar is below table.)
DAIRY PRODUCER
GROUP
RECOVERY
RATE
RECOVERY TOTAL SALES
(UNITS)
TOTAL COLLECTED
(UNITS)
DEPOSITS
COLLECTED
REFUNDS
ISSUED
All Producers 83.6% 3,191,599 2,666,659 $5,721,751.25 $4,785,519.50

Note: Data is reported based on information submitted by the dairies listed below. Encorp has not independently audited or third-party verified the reported data.

Bottle Return Process

After consumption, cleaned bottles can be returned to the original store of purchase or any retailer that carries the same brand for sale. Consumers receive a refund of the deposit upon return of undamaged bottles.

Return Locations

For a list of participating retailers and to receive deposit refunds, visit:

Reuse and Recycling

Returned bottles are transported back to the dairies, where they are cleaned, sterilized and refilled with fresh milk. Bottles that are damaged and unsuitable for reuse are sent to local glass recyclers for processing.

Milk Glasses