05 Environmental Impact
5.1 Container Recycling End Fate Report
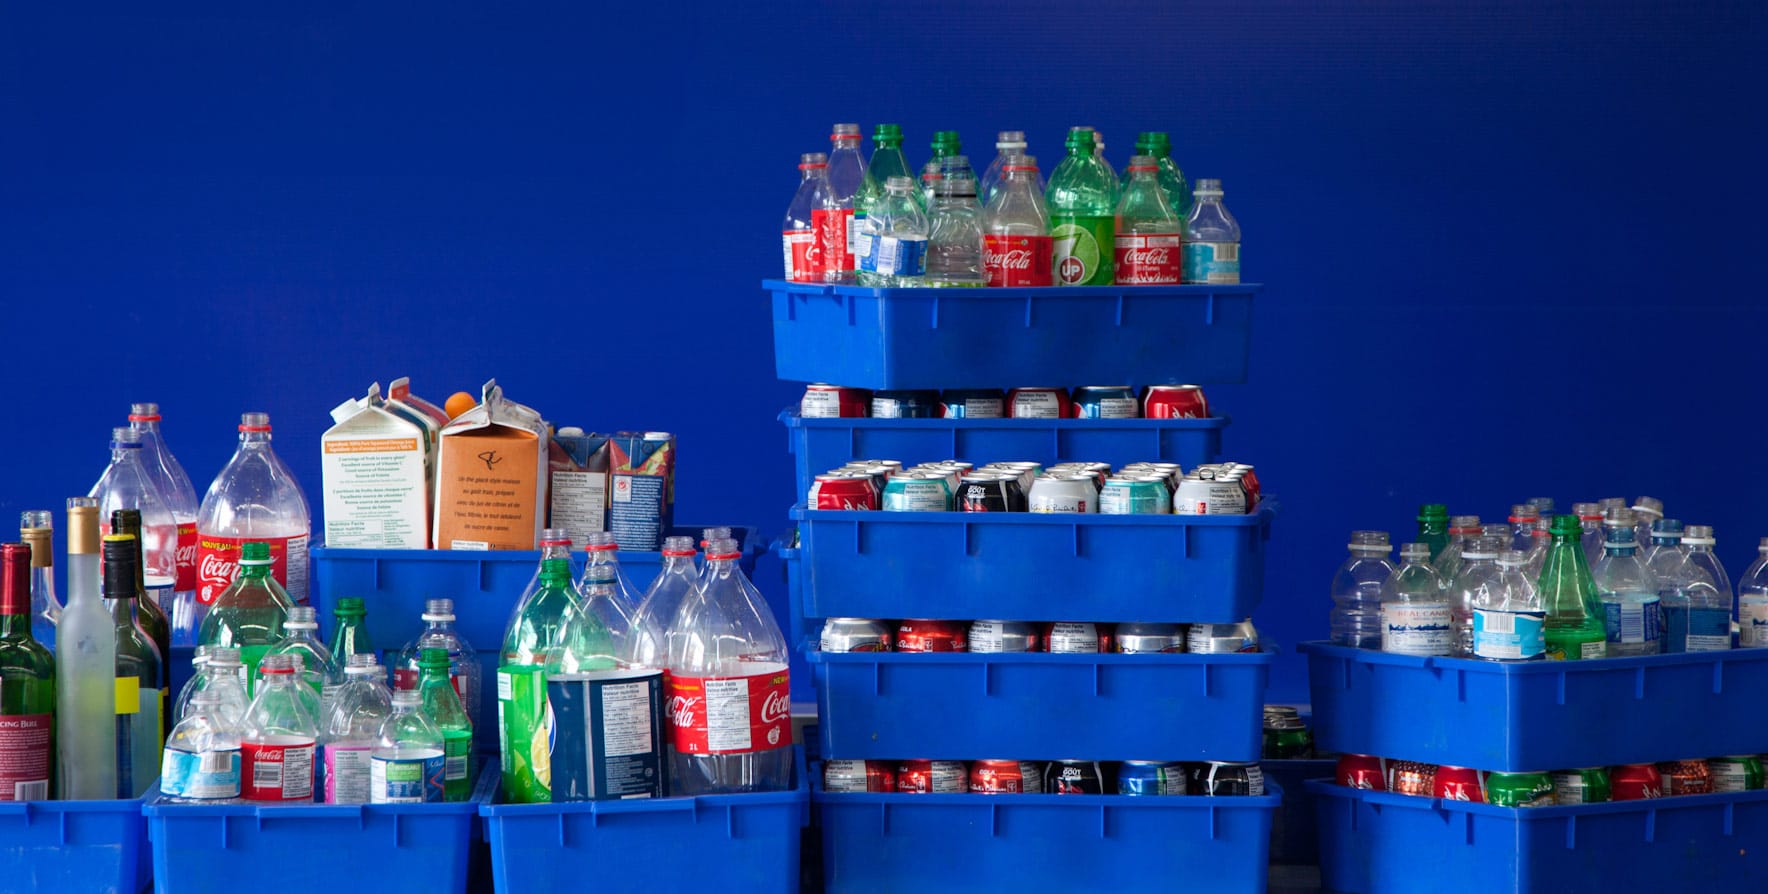
In 2024, Encorp prevented 1.367 billion containers from going to landfills and the environment. All beverage containers collected by Encorp under the deposit return system are shipped to recyclers for further processing into new material in accordance with Section 8 of the BC Recycling Regulation. By diverting useful resources into recycling streams, used beverage containers in BC are being turned into valuable resources within the circular economy.
* Materials collected directly by Encorp.
Pollution Prevention Hierarchy
Encorp is committed to working with producers to reduce environmental impacts throughout the product life cycle and to increase reusability or recyclability at the end of the life cycle. Material collected under the Encorp program falls under the recycle level of the pollution prevention hierarchy, with most material being recycled into new products.
Recyclability of Containers
Per the BC Recycling Regulation, all material collected under the Encorp program may not be disposed of in a landfill or incinerator. Although not all containers collected can be turned back into new containers, they are mostly recycled into materials that can be used to create other products.
Encorp regularly engages with and provides feedback to producers regarding new packaging development or design changes that might result in negative downstream impacts on the recyclability of their products. An example of this is the use of plastic sleeves on aluminum cans and containers made from multiple materials.
Caps On Report
Caps and lids are considered part of the beverage container and when collected, they can be recycled in the appropriate material stream. Through Encorp’s marketing and educational campaigns, consumers are encouraged to leave the caps and lids on containers when returning them to receive their deposit refund.
Encorp conducted regular auditing over a 24-month period. For 2024, the audit was expanded beyond just plastic beverage containers and included gable top cartons and glass bottles. Overall, it was found that 75% of containers were returned with caps, compared to just 48% of containers audited in 2023. This is the final audit of caps committed to by Encorp.
In conclusion, Encorp attributes the significant increase in containers returned with caps to the marketing and educational campaigns targeting consumers, and specifically encouraging the caps-on behaviour. Encorp will continue to promote this message and behaviour as part of its regular marketing and educational efforts.
5.2 Materials Used to Make New Beverage Containers
Many of Encorp’s registered brand owners have made significant commitments to increase the use of recycled content in the manufacturing of their beverage containers. Encorp is committed to supporting these efforts by ensuring companies have a reliable supply of recycled material through strong recovery rates and clean streams of materials to ensure quality standards for reuse as an input into new beverage container production. Encorp now tracks the percentage of collected materials that are recycled into new beverage containers.
In British Columbia under the Recycling Regulation almost any material type is allowed for beverage container use. Of the various materials collected by Encorp in 2024, three material streams are suitable to be recycled and used as material in the production of new beverage containers. Plastic, aluminum and glass material beverage containers collected in British Columbia are shipped to recyclers for processing and sold to manufacturers to produce new beverage containers. Other material streams collected as part of the Encorp program are downcycled into materials that can be used to create new goods, but not beverage containers.
Aluminum: Approximately 89% of the weight of aluminum beverage containers collected by Encorp was converted to new aluminum beverage containers.
Glass: Approximately 58% of the weight of glass beverage containers collected by Encorp was converted to new glass beverage containers.
Plastic: Approximately 44% of the weight of plastic beverage containers collected by Encorp was converted to flake for new plastic beverage containers.
Tracking the use of recycled material in the production of new beverage containers is a complex task that relies on the cooperation of different stakeholders involved in the processes. Encorp is committed to working with its processors and recyclers; however, once used beverage containers are recycled and turned back into a usable commodity, the recycler is free to sell the recovered material to any company, regardless of the final use, and as market conditions dictate.
5.3 Environmental Report
The Government of British Columbia has adopted public policies intended to promote a low-carbon economy. As a stewardship agency operating under a provincial regulation, Encorp compiles applicable data, and analyzes and reports on the impacts of its stewardship activities.
Overview
Encorp Pacific is engaged in the collection, transportation, densifying and shipping of recyclable material. Encorp’s activities take place through a variety of partners and are acknowledged through their Scope 3 emissions reporting. For the 2024 calendar year, Encorp completed its sixth third-party greenhouse gas (GHG) inventory; total GHG emissions were 5,901.41 tonnes of carbon dioxide equivalent (tCO2e) compared with the baseline year (2019), which was 11,794.75 tCO2e. The 2024 reporting year represents a decrease of 50% in GHG emissions from baseline. This decrease in GHG emissions comes with an increase in materials processed.
In 2023, Encorp recycled 90,283 metric tonnes of used beverage containers. This decreased by 3% to 87,438 metric tonnes in 2024. The energy saved through the recycling of these materials has been converted into tonnes of CO2e, which is the common measure of GHG emissions, based on the US Environmental Protection Agency’s Waste Reduction Model (WARM). The avoided emissions published in this report were calculated using WARM Version 15.1 (Updated: 09/2022). Refer to the End Fate table in Section 5.1.
In total, BC’s used beverage container deposit return system contributed to the reduction of about 125.9 thousand tonnes of CO2e from being released into the atmosphere in 2024 as compared with 125.2 thousand tonnes in 2023, and 104.8 thousand tonnes in the 2019 baseline year. These steady CO2e savings reflect the consistently high volumes of recycled aluminum and plastic containers, alongside ongoing efforts to recover and recycle polycoat containers.
Compactor Trucks
In 2020, one hybrid CNG-electric compactor truck was added to the operations by way of a pilot project; since then, two additional trucks have been added to the fleet. These trucks travel to depots and conduct on-site compaction. This compaction reduces the total number of loads required to transport material from the depots to the processing facilities. Furthermore, these compactor trucks are powered by compressed natural gas and not charged by the electrical grid. For the 2024 reporting year, the compactor trucks drove 65,667 kilometres, which reduced dieselequivalent kilometres by 160,000 kilometres, resulting in a net GHG reduction of 352 tCO2e.
GHG Emissions Summary
The following table is a summary of Encorp’s emissions for the 2024 calendar year inventory:
The table above is a summary of Encorp’s emissions for the 2024 calendar year.
* Compactor trucks displaced 160,000 kilometres in diesel-based transportation of goods by road, resulting in a net GHG reduction of 352 tCO2e, which is represented as a reduction in Transporting Goods – Road line above.
† Estimated based on 2019 baseline.
