5 Environmental Impact
- Container end fate report for aluminum, plastic, glass, polycoat, pouches, bag-in-a-box and bi-metal containers.
- Material used to make new containers.
- Reusability and recyclability of containers.
- Detailed environmental report on the reduction in greenhouse gas emissions, energy savings and CO2 equivalent reduced from recycling.
5.1 Container Recycling End Fate Report
In 2023, Encorp prevented 1.375 billion containers from going to landfills and the environment. All beverage containers collected by Encorp under the deposit return system are shipped to recyclers for further processing into new material in accordance with Section 8 of the BC Recycling Regulation. By diverting useful resources out of waste and into recycling streams, used beverage containers in BC are being turned into valuable resources within the circular economy.
| Material Type |
Fate of Material (2023) |
Containers Sold
(% of total) |
Recovery %
(by weight of total recovered) |
Energy
Savings |
Weight Diverted
from Landfill (Mt) |
Tonnes CO2
Reduced |
|---|---|---|---|---|---|---|
Aluminum  |
Aluminum cans collected were sold and shipped to re-melt facilities in the USA and turned back into sheet stock for new cans. Video: Aluminum Can Recycling Process |
36.79% | 84.10% | 93% | 6,889 | 69,464 |
Plastic |
Plastic containers were sold and shipped to a recycler in Canada to their facilities in British Columbia and Alberta. The commodity is cleaned and pelletized to become FDA-approved new raw material for manufacturers of various plastic products including new containers, strapping material and fibres. Video: Plastic Bottle Recycling Process |
40.16% | 78.50% | 86% | 17,791 | 20,709 |
Glass |
Glass containers were processed in British Columbia and shipped to a facility that produces new glass bottles in Seattle, Washington; a manufacturing plant that produces fibreglass insulation in Alberta; and a facility that manufactures sandblasting materials in Quesnel, BC. Video: Glass Bottle Recycling Process |
11.33% | 89.90% | 34% | 61,367 | 20,046 |
Polycoat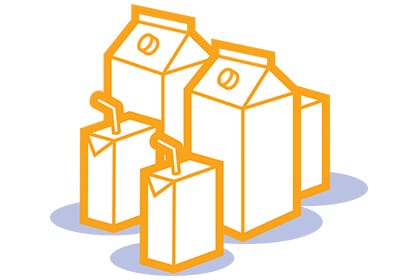 |
Polycoat containers collected were sold to brokers in Canada and the USA. One broker sold approximately 5% of polycoat containers to a manufacturer in Des Moines, Iowa, where they produce building boards that are used as an alternative to traditional wallboards, roofing, floor underlayment, ceiling tiles and structured insulated panel. The remaining 95% polycoat containers were sold to a facility who shipped the material to recyclers in India, Malaysia and Korea where the fibre from the polycoat was recycled and used to make the white top layer of boxboard and toilet tissue. The plastic film and aluminum were used to make plastic lumber. Video: Gable Top Cartons and Drink Box Recycling Process |
10.89% | 60.50% | 53% | 3,528 | 12,899 |
Pouches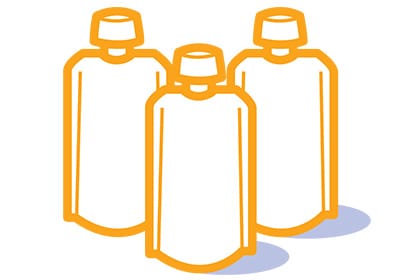 |
Encorp has a viable end market through a recycler in New Jersey who is using this material to make various products such as composite decking, buckets, storage totes, non-food grade containers and trays. | 0.42% | 32.90% | 53% | 13 | 14 |
Bag-In-A-Box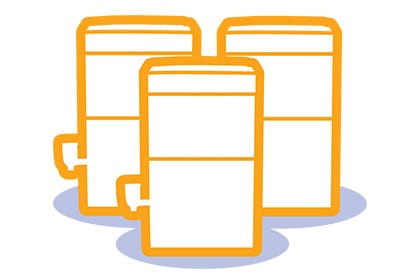 |
The plastic bladders inside the bag-in-a-box containers are shipped to the recycler in New Jersey for making products such as composite decking, buckets, storage totes, non-food grade containers and trays. Cardboard from the outer layer of the boxes was recycled by local processors. | 0.24% | 54.20% | 53% | 524 | 1,669 |
Bi-Metal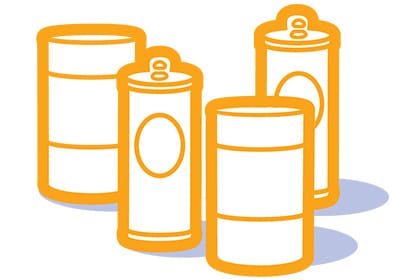 |
Other metal containers including bi-metal were sold to scrap metal dealers for metal recovery. | 0.17% | 78.60% | 82% | 171 | 348 |
| 2023 Total | 100% | 85% | 90,283 | 125,149 | ||
| For reference 2022 Total |
100% | 82.50% | 90,257 | 123,533 |
Pollution Prevention Hierarchy
Encorp is committed to working with producers to reduce environmental impacts throughout the product life cycle and to increase reusability or recyclability at the end of the life cycle. Material collected under the Encorp program falls under the recycle level of the pollution prevention hierarchy, with a small percentage reporting to waste.
Recyclability of Containers
Per the BC Recycling Regulation, all material collected under the Encorp program may not be disposed of in a landfill or incinerator. Although not all containers collected can be turned back into new containers, they are mostly recycled into materials that can be used to create other products.
Encorp regularly engages with and provides feedback to producers regarding new packaging development or design changes that might result in negative downstream impacts on the recyclability of their products. An example of this is the use of plastic sleeves on aluminum cans and multi-material containers.
2023 Caps On Report
Caps and lids are considered part of the beverage container and are collected for recycling through the appropriate material streams. Consumers are encouraged to leave the caps and lids on the containers when returning them or to bring them back with the beverage containers.
Encorp conducted regular auditing over a 24-month period to determine the percentage of containers being returned with the caps on the container or separate from the container.
-
Findings
In 2023, Encorp directed efforts on auditing the plastic beverage material stream to determine the percentage of containers being returned with the caps on or separate from the container. Encorp audited 112 mega bags of plastic beverage containers and found that, on average, 48% of plastic containers were returned with the cap attached. The percentage of caps on from numerous Return–It collection sites varied throughout the January–December audit period from as low as 30% to as high as 79%.
-
Conclusions
To continue to support the tracking and collection of caps and lids, Encorp will continue to conduct regular audits of plastic containers and will expand this audit process to include gable top cartons and glass beverage containers for a period of 12 months in 2024. A dedicated marketing campaign educating consumers to leave the caps on the beverage containers was implemented in 2022 and will continue to be a part of Encorp’s annual consumer awareness initiatives going forward.
5.2 Materials Used to Make New Containers
Many of Encorp’s registered brand owners have made significant commitments to increase the use of recycled plastic in the manufacturing of their beverage containers. Encorp is committed to supporting these efforts by ensuring companies have a reliable supply of recycled plastic through strong recovery rates and clean stream of material to ensure quality standards for reuse as an input into new beverage container production. Encorp now tracks the percentage of collected materials that are recycled into new containers.
Encorp collects a variety of containers that are shipped to recyclers for further processing into new materials. Of the numerous materials that Encorp collected in 2023, three material streams are recycled back into new beverage containers. Plastic, aluminum and glass material streams collected in British Columbia are shipped to manufacturers to produce new beverage containers. Other material streams collected as part of the Encorp program are downcycled into materials that can be used to create new goods but not beverage containers.
Aluminum: 100% of the aluminum collected by Encorp was sold to re-melt facilities based in the USA to make sheet stock for new aluminum cans.
Glass: Approximately 76% of the weight of glass containers collected by Encorp is processed in British Columbia and sold to a facility in Washington, USA, to produce new glass bottles.
Plastic: Of the total weight of plastic containers collected by Encorp and sold for recycling in 2023:
- Approximately 56% of total weight collected was PET Clear plastic. This stream was pelletized and recycled into food grade new beverage containers.
- Approximately 18% of total weight collected was HDPE Natural plastic. This stream was pelletized and recycled into food grade containers.
Polycoat: 0% of the total weight collected was used to produce new polycoat containers.
Pouches: 0% of the total weight collected was used to produce new pouches.
Bag-In-A-Box: 0% of the total weight collected was used to produce new bag-in-a-box containers.
Bi-Metal: 0% of the total weight collected was used to produce new bi-metal containers.
Tracking the use of recycled material in the production of new beverage containers is a complex task and relies on the cooperation of different stakeholders involved in the processes. Encorp is committed to working with its consolidators and recyclers; however, once used beverage containers are recycled and turned back into a usable commodity, the consolidator and recycler are free to sell the recovered material to any company regardless of the final use and as market conditions dictate.
5.3 Reusability of Containers
Encorp committed to conducting a scan of emerging trends for refillable containers with its brand owners. In 2023, the scan consisted of a review of websites and news releases for the top 30 brand owners who sell ready-to-drink beverages in British Columbia. In addition to the brand owner scan, a survey was sent out to all registered brand owners to identify organizations that are currently using or have plans to move towards refillable beverage containers and to identify any barriers in providing refillable solutions.
Brand Scan Results
The brand scan found no brands that are part of the Encorp program offer refillable containers that are registered as part of the system; however, there are some efforts being made globally within reusable packaging. One of the key findings from the scan is that several of Encorp’s registered brand owners have made significant commitments to increase the use of recycled content in the plastic beverage containers they sell into the BC and global markets.
The survey consisted of three questions and was distributed to all brand owners with 55 completing the survey. Below are the survey results:
5.4 Environmental Report
The Government of British Columbia has adopted public policies intended to promote a low-carbon economy. As a stewardship agency operating under a provincial regulation, Encorp compiles applicable data, and analyzes and reports on the impacts of its stewardship activities.
Overview
Encorp is engaged in the collection, transportation, processing and shipping of recyclable material. Encorp’s activities take place through a variety of partners, who are acknowledged through the Scope 3 emissions reporting. Since the 2019 greenhouse gas (GHG) emissions baseline was established, Encorp has seen year-over-year reductions in GHG emissions.
For the 2023 calendar year, Encorp completed its fifth third-party GHG inventory. Total GHG emissions were 7,890.87 tonnes of carbon dioxide equivalent (tCO2e) compared with the restated baseline year of 11,794.75 tCO2e – resulting in a 33% decrease (or a 3,903.88 tCO2e reduction). Continued emphasis on transporting goods by rail (where possible) was a key driver of this reduction.
Restatement of Baseline Emissions
In 2022, Encorp recycled 90,257 metric tonnes of used beverage containers. This increased by 0.03% to 90,283 metric tonnes in 2023. The energy saved through the recycling of these materials has been converted into tonnes of CO2e, which is the common measure of GHG emissions, based on the US Environmental Protection Agency’s Waste Reduction Model (WARM). The avoided emissions published in this report were calculated using WARM Version 15.1 (Updated: 09/2022). Refer to the End Fate table Section 5.1.
In total, BC’s used beverage container deposit return system contributed to the reduction of about 125.2 thousand tonnes of CO2e from being released into the atmosphere in 2023 as compared with 123.5 thousand tonnes in 2022, and 104.8 thousand tonnes in the 2019 baseline year. This increased CO2e saving is primarily attributable to a continued increase in the volume of aluminum and plastic in the overall number of recycled used beverage containers as well as an increase in the volume of recycled polycoat containers.
Increased Stakeholder Reporting
2023 saw a 40% increase in participation across all recovery partners – most significantly from depots.
Increased Transportation by Rail
In 2019, processed aluminum used beverage containers were transported primarily by road, and in 2023 were primarily transported by rail. While the total weight of aluminum processed under the deposit return system in BC increased by 25% from 2019 to 2023, the associated emissions fell by 49%.
Compactor Trucks
Hybrid CNG-electric compactor trucks were added to Encorp’s operations in 2022 by way of a pilot project. These trucks travelled to depots and conducted on-site compaction. This compaction reduced the total number of loads required to transport material from the depots to the processing facilities.
Furthermore, these compactor trucks were powered by compressed natural gas and not charged by the electrical grid. For the 2023 reporting year, the compactor trucks drove 148,716 kilometres that displaced 362,000 kilometres in diesel-based transportation resulting in a net GHG reduction of 833 tCO2e.
Figure 1 shows the relative change of each emissions measurement relative to the 2019 Baseline.
While recycling has an overall net benefit in terms of energy and emissions savings, the recycling process itself requires energy and thus has GHG emissions associated with it. When estimating net savings, Encorp calculates the GHG emissions that are specifically associated with its stewardship activities. This includes the collection, transportation, processing and shipping of the recyclable material generated by the beverage container deposit return system in BC. These activities take place through a variety of recovery partners; Encorp takes responsibility for these GHG contributions through the Scope 3 emissions reporting found below.
In 2023, Encorp achieved a 33.0% reduction in GHG emissions versus the 2019 baseline. For the 2023 calendar year, total GHG emissions from Encorp’s operations were 7,890.87 tonnes of carbon dioxide equivalent (tCO2e).
This represents a 33% reduction (3,903.88 tCO2e) overall since the baseline year (2019).
Methodology
Encorp’s 2023 GHG emissions inventory was conducted by Standard Carbon Inc. in accordance with the Greenhouse Gas Protocol – Corporate Accounting and Reporting Standard, Revised Edition. The GHG Protocol is published jointly by the World Resources Institute and the World Business Council for Sustainable Development [ghgprotocol.org]
Organizational Boundaries
Encorp used the operational control approach to determine its organizational boundary and included all operations over which it has operational control in its inventory. The following facilities were included:
- Head office and quality assurance facility (2 sites)
- Processing facilities (15 sites)
- Return-It Depots (162 of 180 collection sites)
- Commodity shipping to end market recyclers (14 vendors)
- Haulage of material from depot to consolidator (29 vendors)
Encorp did not exercise operational control over electricity, heat or equipment at the depot or consolidator facilities; therefore, these are included as Scope 3 emissions.
Inventory Boundaries
The GHG Protocol requires the inclusion of Scope 1 and 2 emissions and recommends including relevant Scope 3 emissions. Scope 3 emissions are considered relevant when they occur from activities material to an organization’s business and goals, and for which reliable data is available. Encorp included emissions from the following activities under Scopes 1, 2 and 3:
Scope 1: Includes direct GHG emissions from sources that are owned or controlled by Encorp, including natural gas for building heat. In this reporting year, the entity controlling data relating to the head office’s building heat did not provide the quantity of natural gas. Given no material changes to Encorp’s head office operations or footprint, the GHG emissions were estimated to be identical to the 2019 baseline.
Scope 2: Includes GHG emissions from electricity purchased from the utility.
Scope 3: Includes indirect GHG emissions that are consequences of Encorp’s operations, but that occur at sources owned by another company or entity:
- - Electricity and heat at depots and consolidators
- - Business travel by Encorp employees (via air, water and road)
- - Material transportation and shipment by third parties
- - Paper consumption
- - Employee Commuting
Scope 3 emissions from waste were excluded because of a lack of available data. Emissions from waste are also relatively immaterial, compared with Encorp’s overall GHG inventory.
Emission Factors
The 2023 GHG emissions inventory was created using emissions factors from a variety of sources including the most recent versions of each of the following:
- US Environmental Protection Agency
- US Environmental Protection Agency (eGRID Database)
- UN Intergovernmental Panel on Climate Change
- BC Hydro
- BC Transit
- BC Ferries
- World Shipping Council
GHG Emissions Summary
The following table is a summary of Encorp’s emissions for the 2023 calendar year inventory:
Figure 2 pictured here is a summary of Encorp’s emissions for the 2023 calendar year.
* In 2019 aluminum was transported primarily by road, and in 2023 is primarily by rail. Total weight of aluminum processed increased by 25% from 2019 to 2023 but associated GHG emissions fell by 49%.
** Compactor trucks displaced 362,000 km in diesel-based transportation of goods by road resulting in a net GHG reduction of 833 tCO2e, which is represented as a reduction in Transporting Goods – Road line above.
Notes on the Scope 1, 2, and 3 Data
1. Scope 2 Emissions – According to the 2015 GHG Protocol Scope 2 guidance, businesses must report their Scope 2 emissions in two different ways:
- Market-based – using supplier-specific emissions factors and/or those from contractual instruments like renewable energy certificates (RECs), and
- Location-based – reflecting grid emissions factors.
Encorp did not purchase RECs, and the emissions factor in both reporting formats is identical; therefore, only one number is shown. And, in the 2019 baseline year, Scope 2 emissions were calculated using location-based figures.
2. Sequestered Carbon Release – Burning biomass or biofuels, for example, releases direct CO2 emissions into the atmosphere, and is reported separately from the above scopes. One used beverage container return depot reported burning wood pellets in Encorp’s 2023 calendar year inventory.
3. Carbon Offsets and RECs – Carbon offsets and RECs were not purchased by Encorp in 2023.
4. Variance:
- Scope 1: Electricity – small year-over-year increase occurred in 2023, which can be explained by a change in the BC Hydro emissions factor.
- Scope 3: Electricity – From 2022 to 2023, 8% more consolidators and 35% more depots reported electricity data.
- In this reporting cycle, 86% of depots reported their emissions.
- Scope 3: Heat – From 2022 to 2023, 14% more consolidators and 53% more depots reported heating data.
- In this reporting cycle, 86% of depots reported their emissions.
- Scope 3: Paper – Encorp has moved to be as paperless as possible within the office and for external marketing material printed by Encorp. Even though there was an increase in the overall volume of printed materials in 2023 from 2022, the emphasis on going paperless continues to result in a GHG reduction from 2019 to 2023.
- Scope 3: Transportation by Road – From 2022 to 2023, Encorp reports a 6% reduction in GHG emissions, and from 2019 to 2023, a 48% reduction in GHG emissions.
- Scope 3: Equipment – Emissions data is currently self-reported by depots and consolidators, resulting in some under- or non-reporting of GHG emissions resulting from the operation of equipment.
- Scope 3: Transportation by Water – From 2022 to 2023, the weight of materials transported to end markets by water increased 573% and the total number of containers increased by 618%. The key reasons for the increase observed from 2019 to 2023 include:
- The commodity markets fluctuate from year to year - The price paid for materials will vary widely per year and per market, which affects commercial choices of the consolidators around whether to send material overseas.
- The demand for materials fluctuates from year to year - The reduced demand for polycoat in North America in 2023 affected commercial choices around whether to send this material overseas.
5. Scope 3: Transportation of Goods by Rail – As described in previous GHG inventories, and in this current one, Encorp has a stated goal of reducing GHG emissions from the transporting of goods by road in favour of transporting goods by rail.
- The GHG Emissions Summary table indicates that the strategy of shifting from road to rail is resulting in an overall reduction in GHG emissions related to the transportation of goods.
- Aluminum (which has been switched primarily from road transportation to rail) has seen an increase in weight from 5,597,471 kilograms in 2019 to 6,978,419 kilograms in 2023 representing a 25% increase, but a reduction in GHG emissions from 706 tCO2e in 2019 to 363 tCO2e in 2023 representing a 49% decrease.
6. Scope 3: Electricity – This is the electrical power consumed by Encorp’s partners. There has been an increase in recyclable material collected and processed since the 2019 baseline. Given Encorp’s role within the recycling ecosystem, this increase in GHG emissions in the short term is an indication that Encorp is succeeding in its mandate of causing larger volumes of used beverage containers to be collected, processed and recycled.
Contribution by Category
Figure 3 pictured here is a breakdown of the GHG emissions by category. The largest sources of GHG emissions for Encorp are Scope 3 Transporting Goods – Road (34%) and Scope 3 Heat (27%). Therefore, continued focus on these two categories will yield the greatest absolute reductions in GHG emissions for Encorp.