5 Environmental Report
- Detailed report on the reduction in greenhouse gas emissions, energy savings and CO2 equivalent.
- End Fate report for aluminum, plastic, glass, polycoat, bi-metal, pouches, and bag-in-a-box containers.
- Material used to make new containers.
5.1 Environmental Report
The Government of British Columbia has adopted public policies intended to promote a low-carbon economy. As a stewardship agency operating under a provincial regulation, Encorp compiles applicable data, and analyzes and reports on the impacts of its stewardship activities.
Executive Summary
Encorp is engaged in the collection, transportation, and processing of recyclable material. Encorp’s activities take place through a variety of partners and are acknowledged through their Scope 3 emissions reporting. Since the GHG emissions baseline was established in 2019, Encorp has achieved a 25.0% reduction in GHG emissions versus the 2019 baseline. These reductions have come from a comprehensive approach to lowering GHG’s across their entire operations.
For the 2022 calendar year, Encorp Pacific (Canada) completed its fourth third-party greenhouse gas inventory. Total GHG emissions were 7,728.21 tonnes of carbon dioxide equivalent (tCO2e. Encorp’s emissions have fallen by 25.0% (2,580.78 tCO2e) overall since their baseline year (2019), with transporting goods by road and Scope 3 heat accounting for the majority of the decreases.
Restatement of Baseline Emissions
GHG emissions for the category of ‘Transportation by road’ was restated for the 2019 baseline year due to a data update.
In 2022, Encorp recycled 90,257 metric tonnes of used beverage containers. The energy saved through the recycling of these materials has been converted into tonnes of carbon dioxide equivalent (CO2e), the common measure of greenhouse gas (GHG) emissions based on the US Environmental Protection Agency’s Waste Reduction Model (WARM). The avoided emissions published in this report were calculated using the WARM Version 15.1 (Updated: 09/2022). Refer to End Fate table in Section 5.2.
In total, British Columbia’s used beverage container deposit return system contributed to the reduction of about 123.5 thousand tonnes of CO2e from being released into the atmosphere in 2022 as compared to 110.2 thousand tonnes in 2021 and 104.8 thousand tonnes in the 2019 baseline year. This increased CO2e savings is primarily attributable to a continued increase in the volume of aluminum and plastic in the overall number of recycled used beverage containers.
While recycling has an overall net benefit in terms of energy and emissions savings, the recycling process itself requires energy and thus has GHG emissions associated with it. When estimating net savings, Encorp calculates the GHG emissions that are specifically associated with its stewardship activities. This includes the collection, transportation, processing, and shipping of the recyclable material generated by the used beverage container deposit return system in British Columbia. These activities take place through a variety of partners and Encorp takes responsibility for these GHG contributions through the Scope 3 emissions reporting found below.
In 2022, Encorp achieved a 25.0% reduction in GHG emissions versus the 2019 baseline. For the 2022 calendar year, total GHG emissions from Encorp’s operations were 7,728.21 tonnes of carbon dioxide equivalent (tCO2e).
This represents a 25% reduction (2,580.78 tCO2e) overall since the baseline year (2019), with transporting goods by road and Scope 3 heat accounting for much of the decrease.
The calculation of Encorp’s GHG emissions is based on the following methodology.
Methodology
Encorp’s 2022 GHG emissions inventory was conducted by Standard Carbon Inc. in accordance with the Greenhouse Gas Protocol – Corporate Accounting and Reporting Standard, Revised Edition. The GHG protocol is published jointly by the World Resources Institute and the World Business Council on Sustainable Development [ghgprotocol.org]
Organizational Boundaries
Encorp used the operational control approach to determine its organizational boundary and included in its inventory all operations over which it has operational control. The following facilities were included in Encorp’s inventory:
- Head Office and Quality Assurance Facility
- Processing Facilities (14 sites)
- Depots (163 of 177 collection sites)
- Commodity Shipping to End Market Recyclers (12 vendors)
- Haulage of Material from Depot to Processor (35 Vendors)
Encorp did not exercise operational control over Electricity, Heat and Equipment at the Depot or Processor facilities, therefore these are included as Scope 3 emissions.
Inventory Boundaries
The GHG Protocol requires the inclusion of Scope 1 and 2 emissions and recommends including relevant Scope 3 emissions. Scope 3 emissions are considered relevant when they occur from activities material to an organization’s business and goals, and for which reliable data is available. Encorp included emissions from the following activities under Scopes 1, 2 and 3:
Scope 1: Includes direct GHG emissions from sources that are owned or controlled by Encorp including natural gas for building heat. In this reporting year, the entity controlling data relating to the head office’s building heat did not provide the quantity of natural gas. Given no material changes to Encorp’s head office operations or footprint, the GHG emissions were estimated to be identical to the 2019 baseline.
Scope 2: Includes GHG emissions from electricity purchased from the utility.
Scope 3: Includes indirect GHG emissions that are consequences of Encorp’s operations, but which occur at sources owned by another company or entity:
- Electricity and heat at depots and processors
- Business travel by Encorp Employees (air, water, and road)
- Material transportation and shipment by third parties
- Paper consumption
- Employee Commuting
Scope 3 emissions from waste were excluded due to a lack of available data. Emissions from waste are also relatively immaterial as compared to Encorp’s overall GHG inventory.
Emission Factors
The 2022 GHG Emissions Inventory was created using emissions factors from a variety of sources including the most recent versions of each of the following:
- U.S. Environmental Protection Agency
- U.S. Environmental Protection Agency (E-Grid Database)
- U.N. International Panel on Climate Change
- B.C. Hydro
- B.C. Transit
- B.C. Ferries
- World Shipping Council
GHG Emissions Summary
The following table is a summary of Encorp’s emissions for the 2022 calendar year inventory:
*The 2019 Baseline has been restated in this report due to a data update.
Notes on the Scope 1, 2, and 3 data
1. Scope 2 Emissions – According to the 2015 GHG Protocol Scope 2 guidance, businesses must report their Scope 2 emissions in two different ways: market-based (using supplier-specific emissions factors and/or those from contractual instruments like renewable energy certificates – RECs) and location-based (reflecting grid emission factors). Encorp did not purchase RECs, and the emissions factor in both reporting formats are identical, therefore only one number is shown. Encorp reports that in the baseline year Scope 2 emissions were calculated using location-based figures.
2. Sequestered Carbon Release – Burning biomass or biofuels, for example, releases direct CO2 emissions into the atmosphere, and are reported separately from the above scopes. There was no sequestered carbon release that was reported for Encorp’s 2022 calendar year inventory.
3. Carbon Offsets and RECs – Carbon Offsets and RECs were not purchased by Encorp in the 2022 year of operations.
4. Variance:
- Scope 3 – Heat – In this reporting cycle 66% of depots reported their emissions. In the 2019 baseline calculation it is believed that fewer depots reported their heating values. It is likely that this level of self-reporting by the depots has caused the variance between the 2019 and 2022 reports.
- Scope 3 – Paper – Encorp has moved to be as paperless as possible within the office and for external marketing material printed by Encorp. These changes to operations have resulted in a reduction from 2019 to 2022.
- Scope 3 – Transportation by Road – There are two reasons for the decrease observed from 2019 to 2022.
- Encorp has implemented operational changes to preference transportation of goods by rail rather than transportation of goods by road.
- Transportation by road as stated in the 2019 baseline year has been restated in this report due to a data update identified as part of internal controls (checks and balances).
- Scope 3 – Equipment – Emissions data is currently self-reported by depots and processors, resulting in some under or non-reporting of GHG emissions resulting from the operations of equipment.
- Scope 3 – Transportation by Water – There are two reasons for the decrease observed from 2019 to 2022.
- The commodity markets fluctuate from year to year. The price paid for materials will vary widely per year and per market, which affects commercial choices around whether to send material overseas or not.
- Commodity markets within North America continue to develop which has kept some of the materials domestic.
- Scope 3 – Transportation of Goods by Rail – As described in previous GHG inventories, and in this current one, Encorp has a stated goal of reducing GHG emissions from the transporting goods by road in favor of transporting goods by rail. Figure 1 below indicates that the strategy of shifting from road to rail has been implemented and that the overall reduction in GHG emissions resulting from the implementation of this strategy has been successful.
- Scope 3 – Electricity – This is the electrical power consumed by Encorp’s partners. There has been an increase in recyclable material collected and processed since the 2019 baseline. This increase in material has resulted in an increase in the Scope 3 Electricity. Given Encorp’s role within the recycling ecosystem, this increase in GHG emissions in the short-term is an indication that Encorp is succeeding in its mandate of causing larger volumes of material to be collected and processed.
Contribution by Category
5.2 Container Recycling End Fate Report
Containers collected by Encorp in 2022 were shipped to recyclers for further processing into new material in accordance with Section 8 of the Recycling Regulation.
| Material Type |
Fate of Material (2022) |
Containers Sold
(% of total) |
Recovery %
(by weight of total recovered) |
Energy
savings |
Weight diverted
from landfill (mt) |
Tonnes CO2
reduced |
|---|---|---|---|---|---|---|
Aluminum  |
Aluminum cans collected were sold and shipped to re-melt facilities in the USA and turned back into sheet stock for new aluminum cans. Video: Aluminum Can Recycling Process |
36.83% | 81.61% | 93% | 6,895 | 69,513 |
Plastic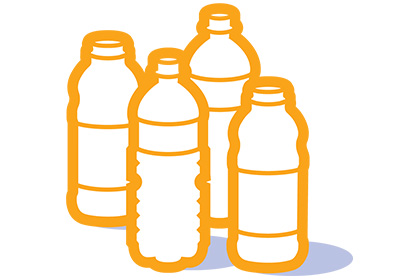 |
Plastic containers were sold and shipped to a reputable recycler in Canada – to their facilities in British Columbia and Alberta. The commodity is cleaned and pelletized to become new raw material for the manufacture of various plastic products, including new containers, strapping material and fibres. Video: Plastic Bottle Recycling Process |
39.70% | 78.13% | 86% | 17,962 | 20,908 |
Glass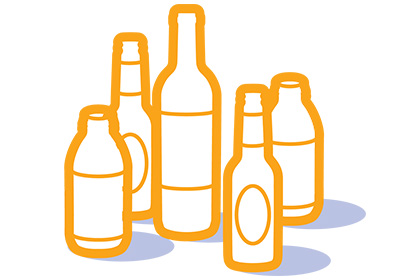 |
Glass containers were processed in British Columbia and shipped to various end markets, including: a plant that produces fibreglass insulation in Alberta; a facility that produces new glass bottles in Seattle, USA; a facility that manufactures sandblasting materials in Quesnel, BC; and municipal sites that use crushed glass as construction aggregate. Video: Glass Bottle Recycling Process |
12.30% | 86.20% | 34% | 61,704 | 20,156 |
Polycoat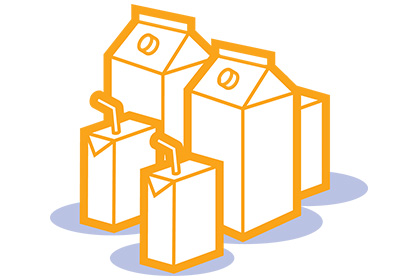 |
Polycoat containers collected were sold and shipped to manufacturing plants in South Korea, Thailand, Malaysia, and India for material recovery in the production of tissue paper from the recovered fibre. Encorp also shipped polycoat containers to a second processor that receives drink box containers atafacilityinDesMoines,Iowa, wherethey are turned into building boards that are used as an alternative to traditional wallboards, roofing, floor underlayment, ceiling tiles, and structured insulated panels. Video: Gable Top Cartons and Drink Box Recycling Process |
9.99% | 59.72% | 53% | 3,004 | 10,982 |
Pouches |
Encorp has found a viable end market through a recycler in New Jersey, who is using this material to make various products such as composite decking, buckets, storage totes, and non-food grade containers and trays. | 0.74% | 21.44% | 53% | 15 | 15 |
Bag-In-A-Box |
The plastic bladders inside the Bag-In-Box containers were shipped to a recycler in Quebec, where it is used for making new products such as composite decking, buckets, storage totes, and non-food grade container trays. Cardboard from the outer layer of the box is recycled by local processors for use in making other paper products. | 0.27% | 48.77% | 53% | 504 | 1603 |
Bi-Metal |
Other metal containers, including Bi-Metal, were sold to scrap metal dealers in British Columbia for metal recovery. | 0.17% | 83.84% | 82% | 174 | 356 |
| 2022 Total | 100% | 82.53% | 90,257 | 123,533 | ||
| For reference 2021 Total |
100% | 83.41% | 89,284 | 110,172 |
5.3 Materials Used to Make New Containers
Many of Encorp’s registered brand owners have made significant commitments to increase the use of recycled content in their plastic beverage containers.
Encorp is committed to supporting those efforts and supporting companies in meeting their recycled content targets by increasing the number of used beverage containers collected and ensuring that the material recycled meets the quality standards for reuse as an input into new beverage container production. As a further step to encourage circular solutions and the reduction of greenhouse gas emissions, Encorp has begun tracking the percentage of Encorp’s collected materials being recycled back into new containers. This is a complex task, and we are working with other recycling affiliates across Canada to harmonize definitions and calculations. This work continues through 2023.