2018 Recovery Rate
82% Encorp's Plan Target
1.1 Program Performance Summary
-

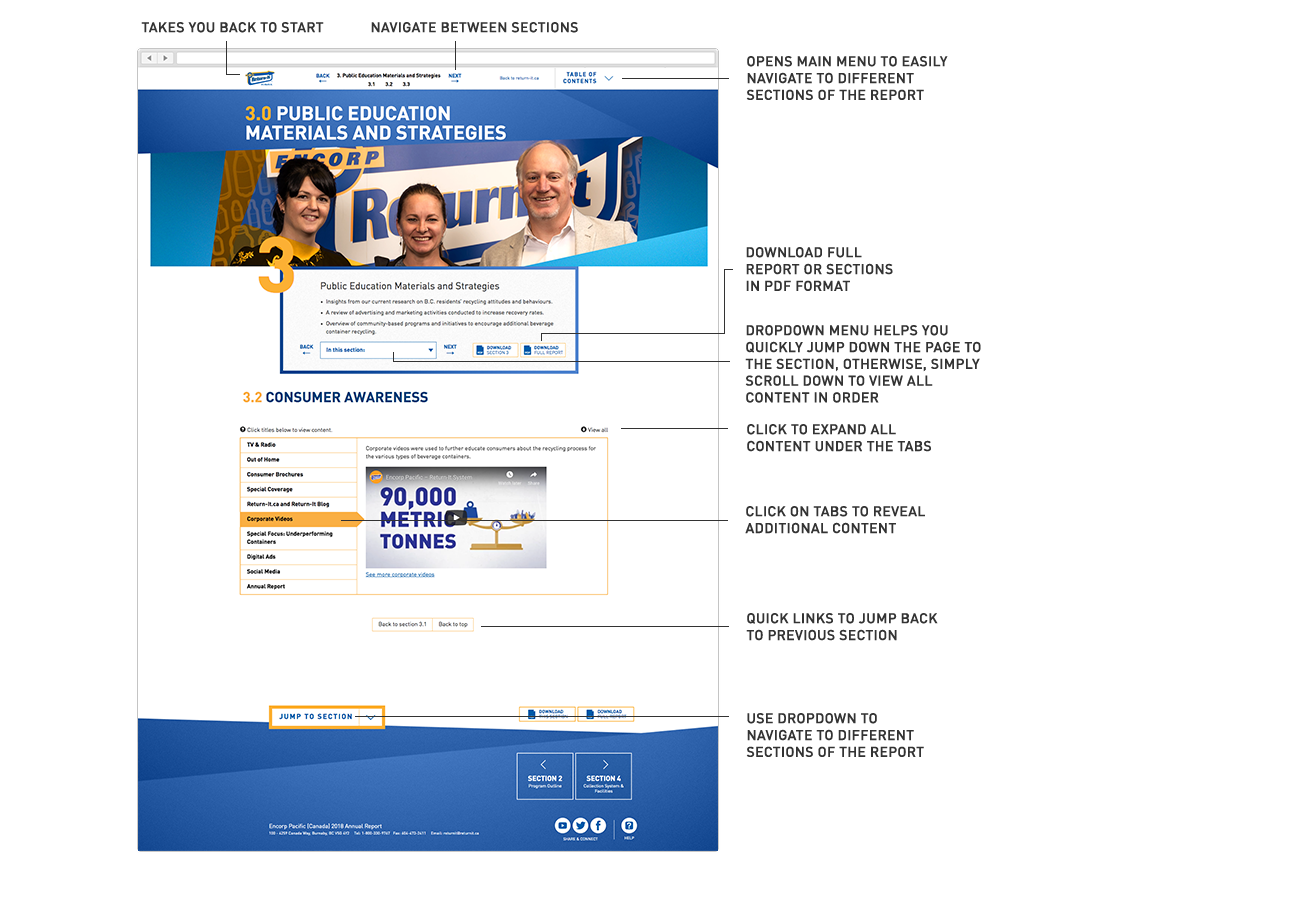
Public education materials and strategies
A multi-million dollar, year-round, province-wide, multi-pronged consumer awareness campaign with strategic action plans and activities resulted in a net consumer awareness level of 99%.
-
Collection system and facilities
Encorp’s collection network consists of 170 Return-It depots. One depot was closed in 2018.
(Joe’s Bottle Depot in Queen Charlotte)Eight depots sold in 2018.
-

Product environmental impact reduction, reusability and recyclability
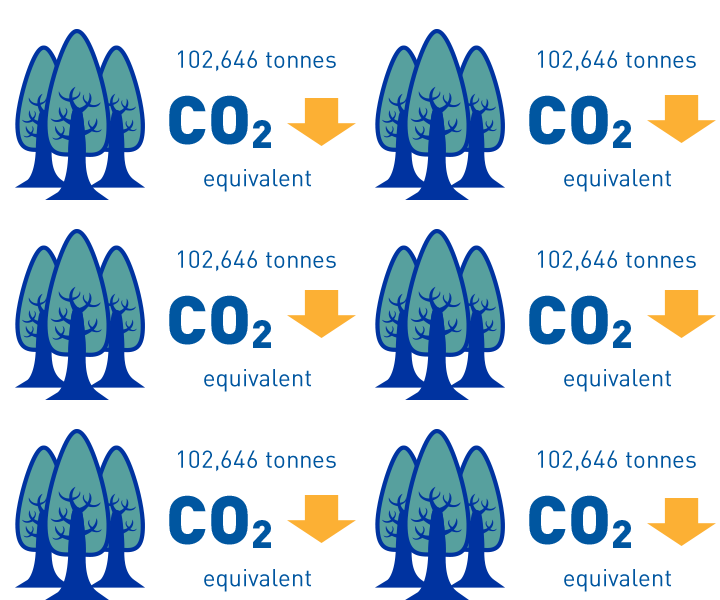
Encorp’s activities in 2018 contributed to the reduction of about 102.6 thousand tonnes of CO2 equivalent being released into the atmosphere, compared to 103.8 thousand tonnes in 2017.
-
Pollution prevention hierarchy and product / component management
Containers collected by Encorp in 2018 were shipped to recyclers for further processing into new material in accordance with Section 8 of the Recycling Regulation.
See End Fate information in Section 5.2
-
Product sold and collected and recovery rate
- Total Sales in units: 1,350,852,403
- Total Product Collected in units: 1,045,466,471
- Recovery Rate: 77.4% compared to 75.8% last year
- Provincial Per Capita Recovery: 209.4 units
- See regional breakdown in Section 6.2
-
Summary of deposits, refunds, revenues and expenses
- Deposits collected: $90,379,585
- Refunds issued: $72,181,564
- Total revenue: $94,617,619
- Total expenses: $94,110,805
- See Financial Statements in Section 9.2
1.2 Comparison of key performance targets
-
Consumer access
98.6% BC Population Access Exceeded 1.6% 97.0% Target 98.6% of B.C.’s population has access to a beverage container return facility compared to the target in our Stewardship Plan of 97%. This target is based on drive times set out in the Stewardship Agencies of British Columbia (SABC) accessibility standard (Auditor’s report reference in Section 9.3, Collection Systems and Facilities). When we add the retail return points the access level increases to 99.5%. This is 2.5% above the target.
-
Consumer awareness
98.0%Container Type Awareness Exceeded 3.0% 95.0% Target 
We set a goal to reach a 95% net awareness level for container types and beverage types which carry a deposit. Research results show that a 98% awareness level has been reached.
90.0% Brand Awareness 
The Return-It brand has reached a 90% awareness level with residents in British Columbia.
-
Carbon footprint
Benchmarking measurements and standardizing the tool Encorp uses has been the goal for several years. In 2018, we calculated results and compared them to the 2017 data. See table in Section 5.
-
Consumer convenience
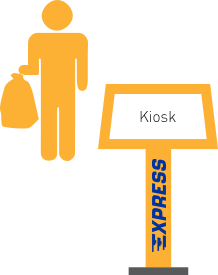
In-depot Express kiosks provide a superior level of consumer convenience by removing the need for customers to sort their containers and wait in line for the refund. Customers just tag their bags, drop them off and are on their way within minutes. The compact Express kiosk reduces the space required for customer sorting. In 2018 we added 11 more locations for a total of 31 Express sites in the province and we are planning to have over 60 locations across the Lower Mainland.
-
Recovery rate
77.4% Recovery Rate Exceeded 2.4% 75.0% Regulation 
The 2018 recovery rate is 77.4%, 2.4% above the regulated requirement of 75%.
 Back to return-it.ca
