5 Environmental Impact
- Detailed report on the reduction in greenhouse gas emissions, energy savings, and C02 equivalent reduced from recycling.
- End Fate report for aluminum, plastic, glass, polycoat and other materials.
5.1 Environmental Report
The Government of British Columbia has adopted public policies intended to promote a low carbon economy. As a stewardship agency operating under a provincial regulation, Encorp compiles applicable data, analyzes and reports on the impacts of its stewardship activities.
In 2017, Encorp recycled 93,828 metric tonnes of used beverage containers. The energy saved through the recycling of these materials has been converted into tonnes of carbon dioxide equivalent (CO2e) the common measure of greenhouse gases (GHGs), based on the US Environmental Protection Agency’s Waste Reduction Model (WARM). The avoided emissions published in this report were calculated using the WARM version 13 [06/14]. (Refer to End Fate table in Section 5.2).
In total, Encorp’s activities in 2017 contributed to the reduction of about 103.8 thousand tonnes of CO2 equivalent being released into the atmosphere, compared to 101.9 thousand tonnes in 2016. The increase in reduction is primarily due to the increase in volume of material recycled.
While recycling has an overall net benefit in terms of energy and emissions savings, the recycling process itself requires energy and thus has GHG emissions associated with it. When estimating net savings Encorp calculates the GHG emissions specifically associated with its stewardship activities.
Since Encorp is not a manufacturing company, the majority of our associated GHG emissions come as a result of transporting materials as well as heating and powering our network of facilities.
Therefore, we define Encorp’s GHG inventory boundary from the point that empty containers enter into the Encorp system at either a depot or retailer, right through to when the materials are delivered to the end processors for recycling into new products.
Greenhouse gas emissions (GHGs) are estimated using conversion factors and methodologies developed by the World Resource Institute’s Greenhouse Gas Protocol (WRIGGP). The collection, transportation and processing services provided to Encorp are done through third party independent contractors and the emissions produced by those activities are classified as Indirect Scope 3 GHG emissions in accordance with the WRIGGP. As there is limited data available for Scope 3 emissions we accept that our information may be less accurate.
Emission calculations from electricity purchased were based on data gathered from a number of depots and processors in each region of the province. Results were used to estimate the energy use per metric tonne of material collected, then extrapolated to the total weight of used beverage containers collected in the province.
The estimated energy consumption in kWhs was then converted into the carbon dioxide emissions using the calculators offered by the WRIGGP. For estimated emissions inventory refer to the table below.
We attribute the reduction in emissions from all sources to changes in the mix of material collected and quantities shipped during the year.
Emissions Inventory Summary
| Type of Emission | 2017 | 2016 |
|---|---|---|
| (tonnes CO2) | ||
| Direct emissions are emissions from sources that are owned or controlled by Encorp | ||
| Employee travel – gas use | 10 | 14 |
| Indirect emissions occur as a consequence of Encorp’s activities, but are from sources not owned or controlled by Encorp. Included are emissions from purchased electricity consumed by Encorp’s offices, depots, processors and transporters[i]. | ||
| Offices (excluding head office) | ||
| Purchased electricity in leased buildings | 4 | 1 |
| Employee domestic air travel/business ferry travel | 17 | 11 |
| Depots - all purchased electricity/all natural gas consumed in owned or leased buildings | 232 | 209 |
| Processors - all purchased electricity/gas consumed in owned or leased buildings | 46 | 65 |
| Transportation – depots to processors | ||
| Diesel fuel (trucks) | 3,617 | 3,657 |
| Transportation – processors to end markets | ||
| Diesel fuel (trucks) | 2,276 | 2,335 |
| Sea Cargo (based on metric tonne km) | 2,884 | 3,042 |
| Total Emissions from all sources | 9,086 | 9,334 |
[i] All indirect emissions except for office use were calculated based on the sample data provided by selected depots, processors, and transporters.
5.2 Container Recycling End Fate Report
All containers collected by Encorp in 2017 were shipped to recyclers for further processing into new material in accordance with Section 8 of the Recycling Regulation.
| Material Type |
Fate of Material (2017) |
Containers Sold
(% of total) |
Recovery %
(by weight) |
Energy
savings |
Weight diverted
from landfill (mt) |
Tonnes CO2
reduced |
|---|---|---|---|---|---|---|
Aluminum 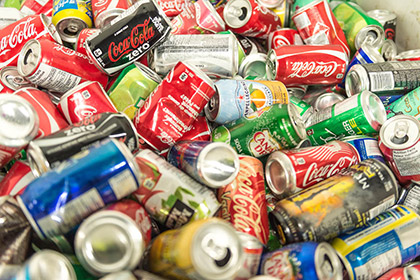 |
Aluminum cans were sold and shipped to a re-melt facility in the USA and turned back into aluminum sheet stock for new cans. Video: Aluminum Can Recycling Process |
33.4% | 80.4% | 93% | 5,149.6 | 52,045 |
Plastic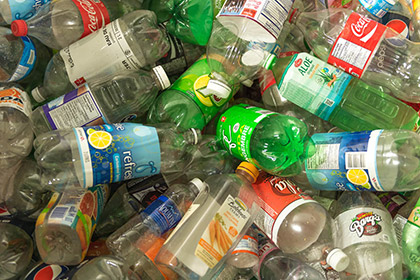 |
Plastic containers were sold to end markets in British Columbia (B.C.) and shipped to their two separate facilities in B.C. and Alberta to be cleaned and pelletized to become new raw material for manufacturers of various plastic products including new containers, strapping material and fibres. Video: Plastic Bottle Recycling Process |
39.6% | 73.5% | 86% | 10,888.0 | 12,338 |
Glass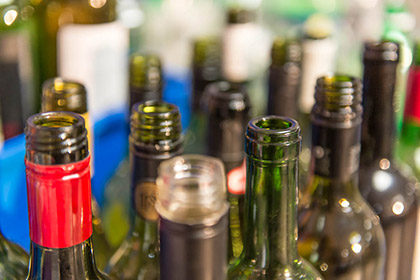 |
Glass containers were processed in British Columbia and shipped to various end markets including a plant that produces fibreglass insulation in Alberta; a facility that produces new glass bottles in Seattle, USA; a facility that manufactures sandblasting materials in Quesnel, B.C.; and municipal sites that use crushed glass as construction aggregates. Video: Glass Bottle Recycling Process |
17.6% | 87.3% | 34% | 75,200.1 | 26,169 |
Polycoat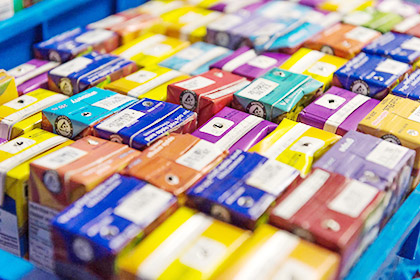 |
Polycoat containers collected in 2017 were sold to end markets in the USA and shipped to manufacturing plants in South Korea and USA for material recovery and production of tissue paper from the recovered fibre. Video: Gable Top Cartons and Drink Box Recycling Process |
8.2% | 66.7% | 53% | 1,813.2 | 12,102 |
Pouches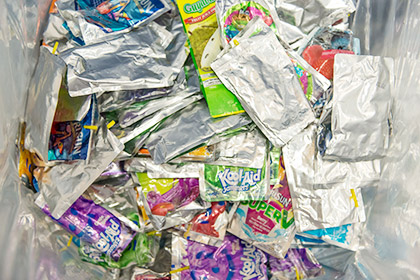 |
Stand up pouches made of layers of plastic and aluminum foil as well as the laminated plastic bags used inside bag-in-box were stored in Delta, B.C. Samples of this material were sent to a manufacturing company in South Korea for material testing. More recently (2018) Encorp has found an end market for stand up pouches in the USA. The material will be used to make composite decking. | 0.5% | 31.2% | 53% | 12.4 | 21 |
Bag-In-Box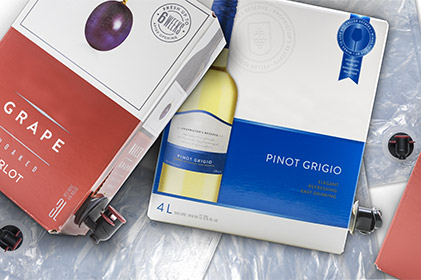 |
Cardboard from the outer layer of the box was recycled by local processors. | 0.3% | 48.1% | 53% | 463.0 | 517 |
Bi-Metal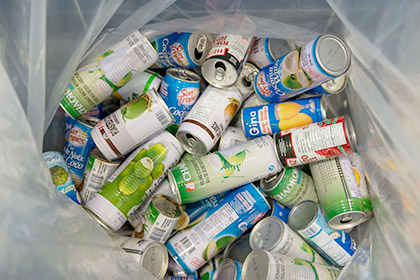 |
Other metal containers including bi-metal were sold to scrap metal dealers in B.C. for metal recovery. | 0.4% | 76.9% | 82% | 301.2 | 618 |
| 2017 Total | 100% | 84.1% | 93,827.5 | 103,810 | ||
| 2016 Total | 85.4% | 92,910.3 | 101,915 |